OPEN-SOURCE SCRIPT
更新済 BTIC Range Midpoints
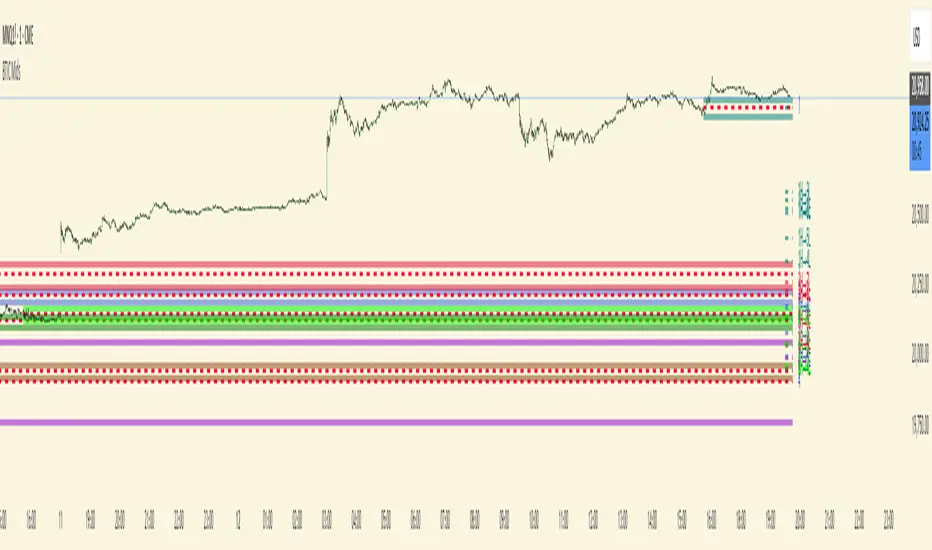
This code analyzes and displays price ranges from 15:15-15:44 ET, the Basis Trade at Index Close session.
It draws horizontal lines showing:
The high of each session
The low of each session
The midpoint (50%) of each session
Connections between different session ranges (50% points between highs and lows)
Key features include:
Works only on 15-minute timeframes or lower
Stores up to 20 days of historical sessions (configurable)
Filters out ranges too far from current price
Color-codes different session ranges
Provides customizable line styles and colors
Labels each range with identifiers
The indicator essentially helps traders identify important price levels from BTIC sessions, which could serve as potential support/resistance areas for future price action.
リリースノート
Added label size customization, label type, and lengthened the midpoint lines.リリースノート
Updated script so that the newest range is labeled as range 1 and the ranges are numbered in order of increasing age.リリースノート
Updated so that each range has it's own distinct color.リリースノート
Made range labels always larger than mid labels.オープンソーススクリプト
TradingViewの精神に則り、このスクリプトの作者はコードをオープンソースとして公開してくれました。トレーダーが内容を確認・検証できるようにという配慮です。作者に拍手を送りましょう!無料で利用できますが、コードの再公開はハウスルールに従う必要があります。
免責事項
この情報および投稿は、TradingViewが提供または推奨する金融、投資、トレード、その他のアドバイスや推奨を意図するものではなく、それらを構成するものでもありません。詳細は利用規約をご覧ください。
オープンソーススクリプト
TradingViewの精神に則り、このスクリプトの作者はコードをオープンソースとして公開してくれました。トレーダーが内容を確認・検証できるようにという配慮です。作者に拍手を送りましょう!無料で利用できますが、コードの再公開はハウスルールに従う必要があります。
免責事項
この情報および投稿は、TradingViewが提供または推奨する金融、投資、トレード、その他のアドバイスや推奨を意図するものではなく、それらを構成するものでもありません。詳細は利用規約をご覧ください。