OPEN-SOURCE SCRIPT
Liquidity Index with Advanced Statistical Normalization
Liquidity Index with Advanced Statistical Normalization
An open-source TradingView indicator for analyzing global liquidity cycles using robust statistical methods
Overview
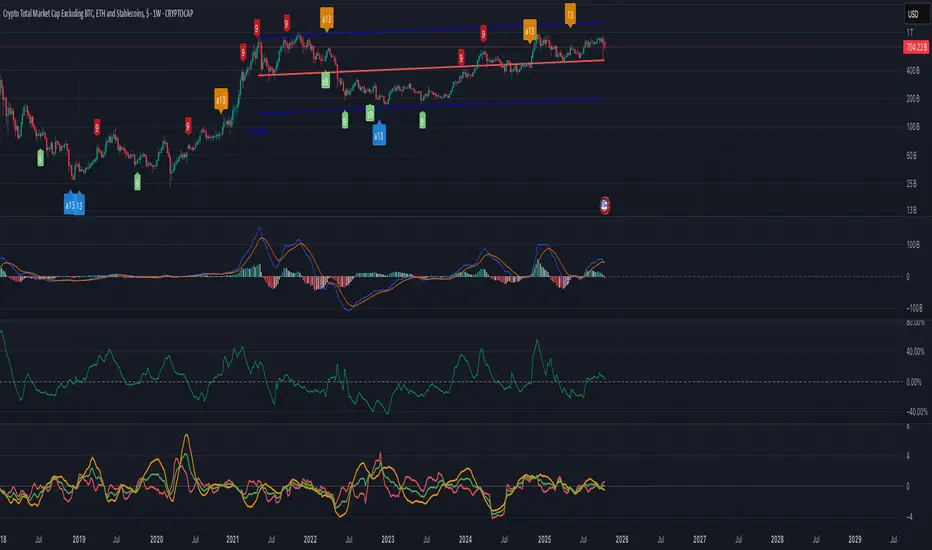
This Pine Script indicator combines multiple macroeconomic data sources to construct a composite liquidity index that tracks global financial conditions. It employs advanced statistical techniques typically found in quantitative finance research, adapted for real-time charting.
Key Features
📊 Multi-Source Data Integration
- Federal Reserve Components: Fed Funds Rate, Reverse Repo (RRP), Treasury General Account (TGA)
- PBOC Components: China M2 Money Stock adjusted by CNY/USD exchange rate
- Volatility Index: MOVE Index (bond market volatility)
🔬 Advanced Statistical Methods
1. Theil-Sen Estimator: Robust trend detection resistant to outliers
2. Triple Normalization:
- Z-score normalization
- MAD (Median Absolute Deviation) normalization
- Quantile normalization via inverse normal CDF
3. Multi-Timeframe Analysis: Short (8-bar) and long (34-bar) windows with blended composite
📈 Signal Processing
- Log-transformation for non-linear relationships
- Smoothing via customizable SMA
- Composite signal averaging across normalization methods
Why This Approach?
Traditional liquidity indicators often suffer from:
- Sensitivity to outliers in economic data
- Assumption of normal distributions
- Single-timeframe bias
This script addresses these issues by:
- Using median-based robust statistics (Theil-Sen, MAD)
- Applying multiple normalization techniques
- Blending short and long-term perspectives
Customization Options
short_length // Short window (default: 8)
long_length // Long window (default: 34)
show_short // Display short composite
show_long // Display long composite
show_blended // Display blended signal
smoothing_length // SMA smoothing period (default: 10)
How to Use
1. Liquidity Expansion (positive values): Risk-on environment, favorable for asset prices
2. Liquidity Contraction (negative values): Risk-off environment, potential market stress
3. Divergences: Compare indicator direction vs. price action for early warnings
Potential Improvements
Community members are encouraged to enhance:
- Additional data sources (ECB balance sheet, BOJ operations, etc.)
- Alternative normalization methods (robust scaling, rank transformation)
- Machine learning integration (LSTM forecasting, regime detection)
- Alert conditions for liquidity inflection points
- Volatility-adjusted weighting schemes
Technical Notes
- Uses request.security() for multi-symbol data fetching
- All calculations handle missing data via nz() functions
- Median-based statistics computed via array operations
- Custom inverse CDF approximation (no external libraries required)
Contributing
This is a foundation for liquidity analysis. Potential extensions:
- LLM Integration: Use language models to parse Fed/PBOC meeting minutes and adjust weights dynamically
- Sentiment Layer: Incorporate crypto funding rates or options skew
- Adaptive Parameters: Auto-tune window lengths based on market regime
- Cross-Asset Validation: Backtest signals against BTC, equities, bonds
---
License: Open source - modify and redistribute freelyDisclaimer: For educational purposes only. Not financial advice.
An open-source TradingView indicator for analyzing global liquidity cycles using robust statistical methods
Overview
This Pine Script indicator combines multiple macroeconomic data sources to construct a composite liquidity index that tracks global financial conditions. It employs advanced statistical techniques typically found in quantitative finance research, adapted for real-time charting.
Key Features
📊 Multi-Source Data Integration
- Federal Reserve Components: Fed Funds Rate, Reverse Repo (RRP), Treasury General Account (TGA)
- PBOC Components: China M2 Money Stock adjusted by CNY/USD exchange rate
- Volatility Index: MOVE Index (bond market volatility)
🔬 Advanced Statistical Methods
1. Theil-Sen Estimator: Robust trend detection resistant to outliers
2. Triple Normalization:
- Z-score normalization
- MAD (Median Absolute Deviation) normalization
- Quantile normalization via inverse normal CDF
3. Multi-Timeframe Analysis: Short (8-bar) and long (34-bar) windows with blended composite
📈 Signal Processing
- Log-transformation for non-linear relationships
- Smoothing via customizable SMA
- Composite signal averaging across normalization methods
Why This Approach?
Traditional liquidity indicators often suffer from:
- Sensitivity to outliers in economic data
- Assumption of normal distributions
- Single-timeframe bias
This script addresses these issues by:
- Using median-based robust statistics (Theil-Sen, MAD)
- Applying multiple normalization techniques
- Blending short and long-term perspectives
Customization Options
short_length // Short window (default: 8)
long_length // Long window (default: 34)
show_short // Display short composite
show_long // Display long composite
show_blended // Display blended signal
smoothing_length // SMA smoothing period (default: 10)
How to Use
1. Liquidity Expansion (positive values): Risk-on environment, favorable for asset prices
2. Liquidity Contraction (negative values): Risk-off environment, potential market stress
3. Divergences: Compare indicator direction vs. price action for early warnings
Potential Improvements
Community members are encouraged to enhance:
- Additional data sources (ECB balance sheet, BOJ operations, etc.)
- Alternative normalization methods (robust scaling, rank transformation)
- Machine learning integration (LSTM forecasting, regime detection)
- Alert conditions for liquidity inflection points
- Volatility-adjusted weighting schemes
Technical Notes
- Uses request.security() for multi-symbol data fetching
- All calculations handle missing data via nz() functions
- Median-based statistics computed via array operations
- Custom inverse CDF approximation (no external libraries required)
Contributing
This is a foundation for liquidity analysis. Potential extensions:
- LLM Integration: Use language models to parse Fed/PBOC meeting minutes and adjust weights dynamically
- Sentiment Layer: Incorporate crypto funding rates or options skew
- Adaptive Parameters: Auto-tune window lengths based on market regime
- Cross-Asset Validation: Backtest signals against BTC, equities, bonds
---
License: Open source - modify and redistribute freelyDisclaimer: For educational purposes only. Not financial advice.
オープンソーススクリプト
TradingViewの精神に則り、このスクリプトの作者はコードをオープンソースとして公開してくれました。トレーダーが内容を確認・検証できるようにという配慮です。作者に拍手を送りましょう!無料で利用できますが、コードの再公開はハウスルールに従う必要があります。
免責事項
この情報および投稿は、TradingViewが提供または推奨する金融、投資、トレード、その他のアドバイスや推奨を意図するものではなく、それらを構成するものでもありません。詳細は利用規約をご覧ください。
オープンソーススクリプト
TradingViewの精神に則り、このスクリプトの作者はコードをオープンソースとして公開してくれました。トレーダーが内容を確認・検証できるようにという配慮です。作者に拍手を送りましょう!無料で利用できますが、コードの再公開はハウスルールに従う必要があります。
免責事項
この情報および投稿は、TradingViewが提供または推奨する金融、投資、トレード、その他のアドバイスや推奨を意図するものではなく、それらを構成するものでもありません。詳細は利用規約をご覧ください。