OPEN-SOURCE SCRIPT
Six Moving Averages Study (use as a manual strategy indicator)

I made this based on a really interesting conversation I had with a good friend of mine who ran a long/short hedge fund for seven years and worked at a major hedge fund as a manager for 20 years before that. This is an unconventional approach and I would not recommend it for bots, but it has worked unbelievably well for me over the last few weeks in a mixed market.
The first thing to know is that this indicator is supposed to work on a one minute chart and not a one hour, but TradingView will not allow 1m indicators to be published so we have to work around that a little bit. This is an ultra fast day trading strategy so be prepared for a wild ride if you use it on crypto like I do! Make sure you use it on a one minute chart.
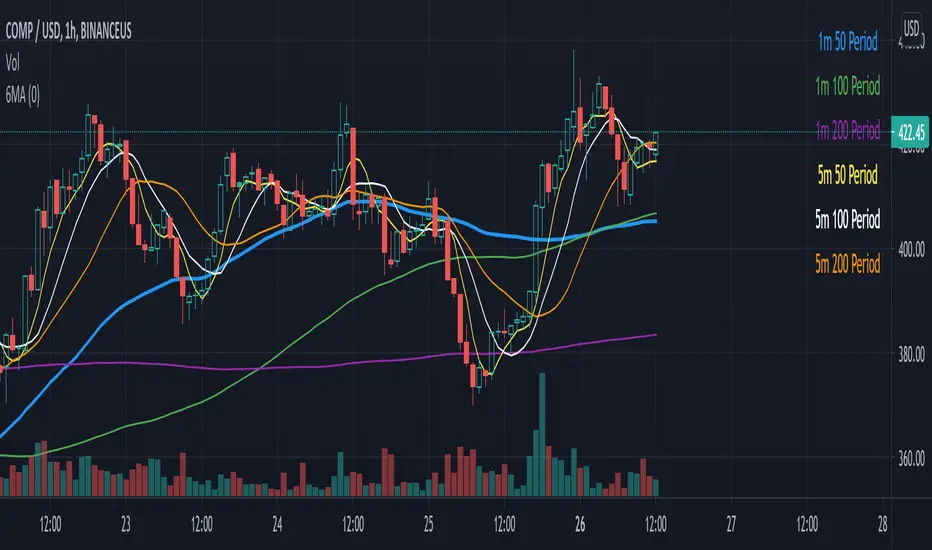
The idea here is that you get six SMA curves which are:
1m 50 period
1m 100 period
1m 200 period
5m 50 period
5m 100 period
5m 200 period
The 1m 50 period is a little thicker because it's the most important MA in this algo. As price golden crosses each line it becomes a stronger buy signal, with added weight on the 1m 50 period MA. If price crosses all six I consider it a strong buy signal though your mileage may vary.
*** NOTE *** The screenshot is from a 1h chart which again, is not the correct way to use this. PLEASE don't use it on a one hour chart.
オープンソーススクリプト
TradingViewの精神に則り、このスクリプトの作者はコードをオープンソースとして公開してくれました。トレーダーが内容を確認・検証できるようにという配慮です。作者に拍手を送りましょう!無料で利用できますが、コードの再公開はハウスルールに従う必要があります。
免責事項
この情報および投稿は、TradingViewが提供または推奨する金融、投資、トレード、その他のアドバイスや推奨を意図するものではなく、それらを構成するものでもありません。詳細は利用規約をご覧ください。
オープンソーススクリプト
TradingViewの精神に則り、このスクリプトの作者はコードをオープンソースとして公開してくれました。トレーダーが内容を確認・検証できるようにという配慮です。作者に拍手を送りましょう!無料で利用できますが、コードの再公開はハウスルールに従う必要があります。
免責事項
この情報および投稿は、TradingViewが提供または推奨する金融、投資、トレード、その他のアドバイスや推奨を意図するものではなく、それらを構成するものでもありません。詳細は利用規約をご覧ください。