OPEN-SOURCE SCRIPT
更新済 Volume x Price
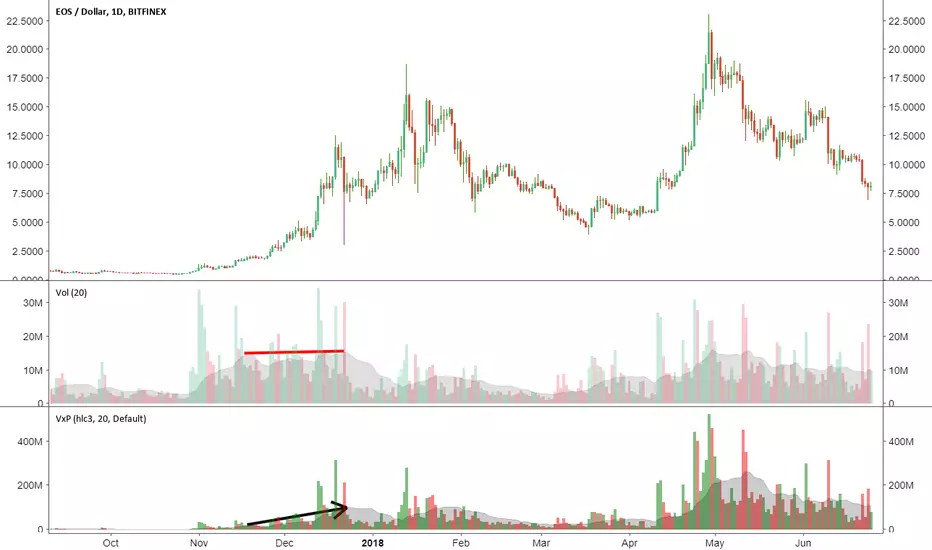
This is a simple indicator that calculates volume times price (money volume). Both asset volume and money volume are important indicators in TA. As you can see in the chart above, money volume (moving average) was increasing while the asset volume was not during late 2017. This could have led to wrong interpretations. Money volume becomes more important to consider when the difference in asset price is 'relatively' high.
Features:
- In addition to default options on volume indicator, it is possible to color volume bars based on "money flow multiplier" sign (close-(low+high)/2)
- Money factor can be disabled to show regular volume
Note: Most exchanges show asset volume but there are some like Bitmex that show money volume. Using this indicator on Bitmex type tickers should be avoided.
PS: I couldn't find any indicator for money volume so I had to develop this.
Your feedback is very welcome. If you know similar indicators, please let me know.
リリースノート
Fixed a bug related to Moving Average Length.Here is another interesting chart:
オープンソーススクリプト
TradingViewの精神に則り、このスクリプトの作者はコードをオープンソースとして公開してくれました。トレーダーが内容を確認・検証できるようにという配慮です。作者に拍手を送りましょう!無料で利用できますが、コードの再公開はハウスルールに従う必要があります。
免責事項
この情報および投稿は、TradingViewが提供または推奨する金融、投資、トレード、その他のアドバイスや推奨を意図するものではなく、それらを構成するものでもありません。詳細は利用規約をご覧ください。
オープンソーススクリプト
TradingViewの精神に則り、このスクリプトの作者はコードをオープンソースとして公開してくれました。トレーダーが内容を確認・検証できるようにという配慮です。作者に拍手を送りましょう!無料で利用できますが、コードの再公開はハウスルールに従う必要があります。
免責事項
この情報および投稿は、TradingViewが提供または推奨する金融、投資、トレード、その他のアドバイスや推奨を意図するものではなく、それらを構成するものでもありません。詳細は利用規約をご覧ください。