OPEN-SOURCE SCRIPT
更新済 trend judgment & multi ma
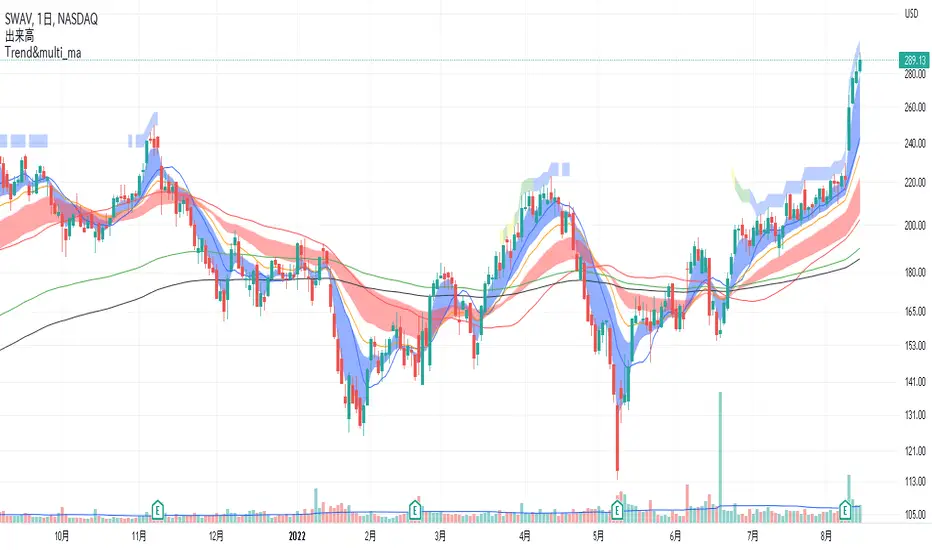
1 The background is filled with the number of matches to the trend template.
For the following conditions, 7 matches are yellow, 8 matches are green, and 9 matches are blue.
1. the stock price is above the 150-day MA and 200-day MA
2. the 50-day MA is above the 200-day MA
3. 200-day MA is in an uptrend for at least one month
4. 50-day MA is above 150-day MA and 200-day MA
5. stock price is 25% or more above 52-week low
6. stock price is 0 - 25% below 52-week high
7. IBD RS is above 70, preferably in the 90s → I don't know the exact formula, so I'm approximating with a formula that gives similar values.
8. when the stock is breaking above the base, the stock price is above the 50MA → It is difficult to judge the base itself, so it is not included in the conditions.
9. volume is high during an upward and low during a downward → volume during an upward > volume during a downward in the past 20 periods.
ex1. the 5-day MA is above the 20-day MA.
2 multi moving averages are shown.
リリースノート
1 The background is filled with the number of matches to the trend template.For the following conditions, 7 matches are yellow, 8 matches are green, and 9 matches are blue.
1. the stock price is above the 150-day MA and 200-day MA
2. the 150-day MA is above the 200-day MA
3. 200-day MA is in an uptrend for at least one month
4. 50-day MA is above 150-day MA and 200-day MA
5. stock price is 25% or more above 52-week low
6. stock price is 0 - 25% below 52-week high
7. IBD RS is above 70, preferably in the 90s → I don't know the exact formula, so I'm approximating with a formula that gives similar values.
8. when the stock is breaking above the base, the stock price is above the 50MA → It is difficult to judge the base itself, so it is not included in the conditions.
9. volume is high during an upward and low during a downward → volume during an upward > volume during a downward in the past 20 periods.
ex1 . the 5-day MA is above the 20-day MA.
2 multi moving averages are shown.
オープンソーススクリプト
TradingViewの精神に則り、このスクリプトの作者はコードをオープンソースとして公開してくれました。トレーダーが内容を確認・検証できるようにという配慮です。作者に拍手を送りましょう!無料で利用できますが、コードの再公開はハウスルールに従う必要があります。
免責事項
この情報および投稿は、TradingViewが提供または推奨する金融、投資、トレード、その他のアドバイスや推奨を意図するものではなく、それらを構成するものでもありません。詳細は利用規約をご覧ください。
オープンソーススクリプト
TradingViewの精神に則り、このスクリプトの作者はコードをオープンソースとして公開してくれました。トレーダーが内容を確認・検証できるようにという配慮です。作者に拍手を送りましょう!無料で利用できますが、コードの再公開はハウスルールに従う必要があります。
免責事項
この情報および投稿は、TradingViewが提供または推奨する金融、投資、トレード、その他のアドバイスや推奨を意図するものではなく、それらを構成するものでもありません。詳細は利用規約をご覧ください。