OPEN-SOURCE SCRIPT
MTF TTM Squeeze Pro
Overview
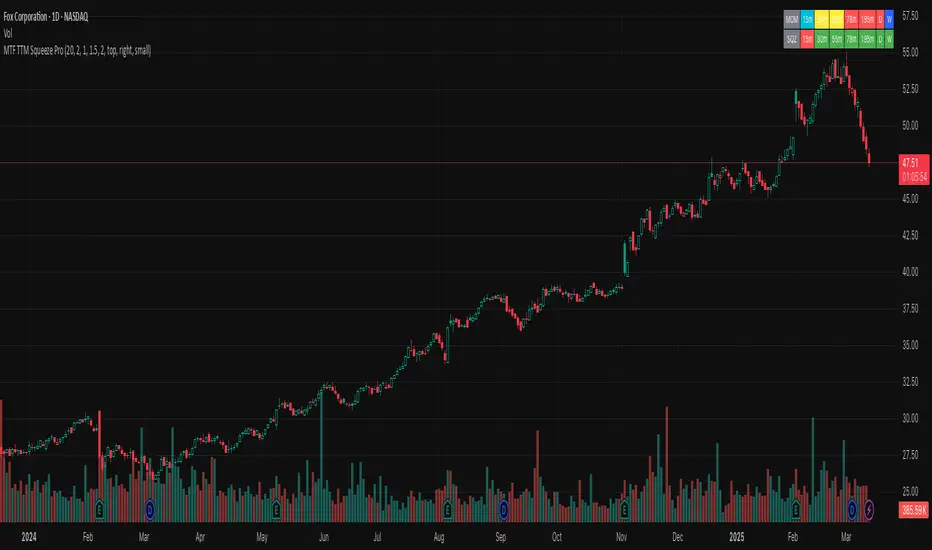
The MTF TTM Squeeze Pro indicator helps traders identify market compression (squeeze) conditions and analyze momentum across multiple timeframes. It is based on the TTM Squeeze concept, which uses Bollinger Bands and Keltner Channels to detect price consolidation periods that often precede strong breakouts.
This script enhances the standard TTM Squeeze by providing a multi-timeframe view, allowing traders to assess market conditions across intraday, daily, and weekly charts simultaneously.
⸻
How It Works
1. Squeeze Detection using Bollinger Bands & Keltner Channels
• High Compression Squeeze (Orange): Strongest squeeze, indicating extreme consolidation.
• Medium Compression Squeeze (Red): Moderate squeeze, potential breakout setup.
• Low Compression Squeeze (Black): Mild squeeze, possible momentum shift.
• No Squeeze (Green): Market is trending, no consolidation detected.
2. Momentum Analysis
The script features a custom linear regression momentum oscillator to gauge market direction:
• Positive rising momentum (Aqua) suggests bullish acceleration.
• Positive falling momentum (Blue) indicates slowing bullish momentum.
• Negative rising momentum (Red) signals bearish weakening.
• Negative falling momentum (Yellow) represents strengthening bearish momentum.
3. Multi-Timeframe Display
The indicator provides a table panel showing squeeze conditions and momentum colors for:
✅ 15m, 30m, 55m, 78m, 195m, Daily (D), and Weekly (W) timeframes.
This makes it easier to spot confluences across different periods, helping traders align their entries with larger trends.
⸻
How to Use
✔️ Look for a high compression squeeze (orange dots) as potential breakout zones.
✔️ Check if momentum colors are aligned across multiple timeframes to confirm direction.
✔️ Trade in the direction of momentum once the squeeze is released.
Best Used For:
📈 Swing Trading – Identify multi-day setups using the D/W squeeze signals.
📉 Intraday Trading – Use 15m-78m signals for faster entries and exits.
⸻
Credits & Open-Source Compliance
This script is inspired by the original TTM Squeeze Pro and based on open-source contributions from the TradingView community. Significant modifications include:
✔️ Improved multi-timeframe data request for momentum & squeeze.
✔️ Enhanced visual display with a compact and informative table panel.
✔️ Added detailed documentation for better usability.
📌 Original Source: TradingView Script by Beardy_Fred

⸻
Final Notes
✅ Designed for stocks, forex, and crypto.
✅ Fully customizable squeeze & momentum settings.
Enjoy trading, and may the squeeze be with you! 🚀
The MTF TTM Squeeze Pro indicator helps traders identify market compression (squeeze) conditions and analyze momentum across multiple timeframes. It is based on the TTM Squeeze concept, which uses Bollinger Bands and Keltner Channels to detect price consolidation periods that often precede strong breakouts.
This script enhances the standard TTM Squeeze by providing a multi-timeframe view, allowing traders to assess market conditions across intraday, daily, and weekly charts simultaneously.
⸻
How It Works
1. Squeeze Detection using Bollinger Bands & Keltner Channels
• High Compression Squeeze (Orange): Strongest squeeze, indicating extreme consolidation.
• Medium Compression Squeeze (Red): Moderate squeeze, potential breakout setup.
• Low Compression Squeeze (Black): Mild squeeze, possible momentum shift.
• No Squeeze (Green): Market is trending, no consolidation detected.
2. Momentum Analysis
The script features a custom linear regression momentum oscillator to gauge market direction:
• Positive rising momentum (Aqua) suggests bullish acceleration.
• Positive falling momentum (Blue) indicates slowing bullish momentum.
• Negative rising momentum (Red) signals bearish weakening.
• Negative falling momentum (Yellow) represents strengthening bearish momentum.
3. Multi-Timeframe Display
The indicator provides a table panel showing squeeze conditions and momentum colors for:
✅ 15m, 30m, 55m, 78m, 195m, Daily (D), and Weekly (W) timeframes.
This makes it easier to spot confluences across different periods, helping traders align their entries with larger trends.
⸻
How to Use
✔️ Look for a high compression squeeze (orange dots) as potential breakout zones.
✔️ Check if momentum colors are aligned across multiple timeframes to confirm direction.
✔️ Trade in the direction of momentum once the squeeze is released.
Best Used For:
📈 Swing Trading – Identify multi-day setups using the D/W squeeze signals.
📉 Intraday Trading – Use 15m-78m signals for faster entries and exits.
⸻
Credits & Open-Source Compliance
This script is inspired by the original TTM Squeeze Pro and based on open-source contributions from the TradingView community. Significant modifications include:
✔️ Improved multi-timeframe data request for momentum & squeeze.
✔️ Enhanced visual display with a compact and informative table panel.
✔️ Added detailed documentation for better usability.
📌 Original Source: TradingView Script by Beardy_Fred
⸻
Final Notes
✅ Designed for stocks, forex, and crypto.
✅ Fully customizable squeeze & momentum settings.
Enjoy trading, and may the squeeze be with you! 🚀
オープンソーススクリプト
TradingViewの精神に則り、このスクリプトの作者はコードをオープンソースとして公開してくれました。トレーダーが内容を確認・検証できるようにという配慮です。作者に拍手を送りましょう!無料で利用できますが、コードの再公開はハウスルールに従う必要があります。
免責事項
この情報および投稿は、TradingViewが提供または推奨する金融、投資、トレード、その他のアドバイスや推奨を意図するものではなく、それらを構成するものでもありません。詳細は利用規約をご覧ください。
オープンソーススクリプト
TradingViewの精神に則り、このスクリプトの作者はコードをオープンソースとして公開してくれました。トレーダーが内容を確認・検証できるようにという配慮です。作者に拍手を送りましょう!無料で利用できますが、コードの再公開はハウスルールに従う必要があります。
免責事項
この情報および投稿は、TradingViewが提供または推奨する金融、投資、トレード、その他のアドバイスや推奨を意図するものではなく、それらを構成するものでもありません。詳細は利用規約をご覧ください。