OPEN-SOURCE SCRIPT
更新済 Trend Force Histogram
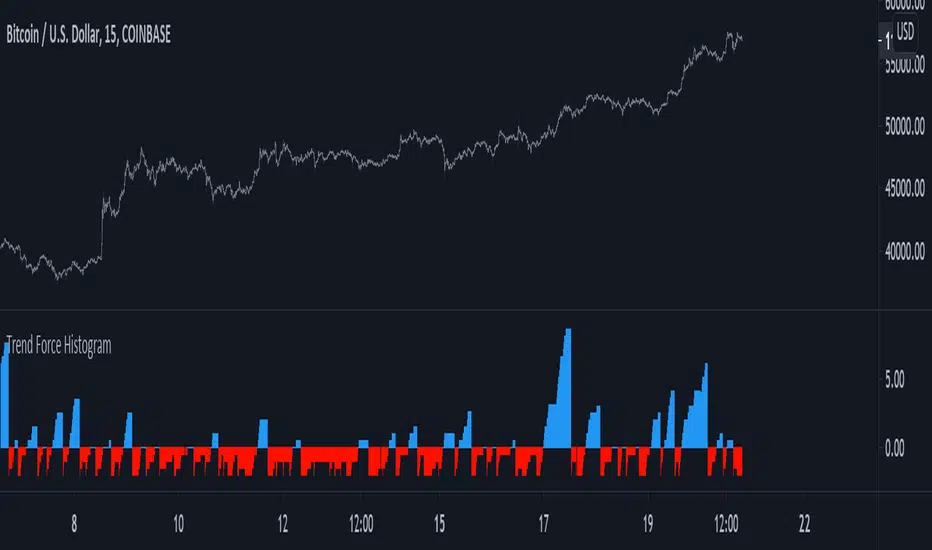
A way to see if market is trending or not trending based on highest and lowest closing price. Market is considered to be trending when the indicator is above 0 (in blue) and ranging when under 0 (in red)
Quite simple but its a way to calculate the trend force since trend can be measured thanks to highest/lowest.
Quite simple but its a way to calculate the trend force since trend can be measured thanks to highest/lowest.
リリースノート
- Updated to v4- Replaced rising/falling
オープンソーススクリプト
TradingViewの精神に則り、このスクリプトの作者はコードをオープンソースとして公開してくれました。トレーダーが内容を確認・検証できるようにという配慮です。作者に拍手を送りましょう!無料で利用できますが、コードの再公開はハウスルールに従う必要があります。
Check out the indicators we are making at luxalgo: tradingview.com/u/LuxAlgo/
"My heart is so loud that I can't hear the fireworks"
"My heart is so loud that I can't hear the fireworks"
免責事項
この情報および投稿は、TradingViewが提供または推奨する金融、投資、トレード、その他のアドバイスや推奨を意図するものではなく、それらを構成するものでもありません。詳細は利用規約をご覧ください。