OPEN-SOURCE SCRIPT
更新済 Previous Day Week Highs & Lows
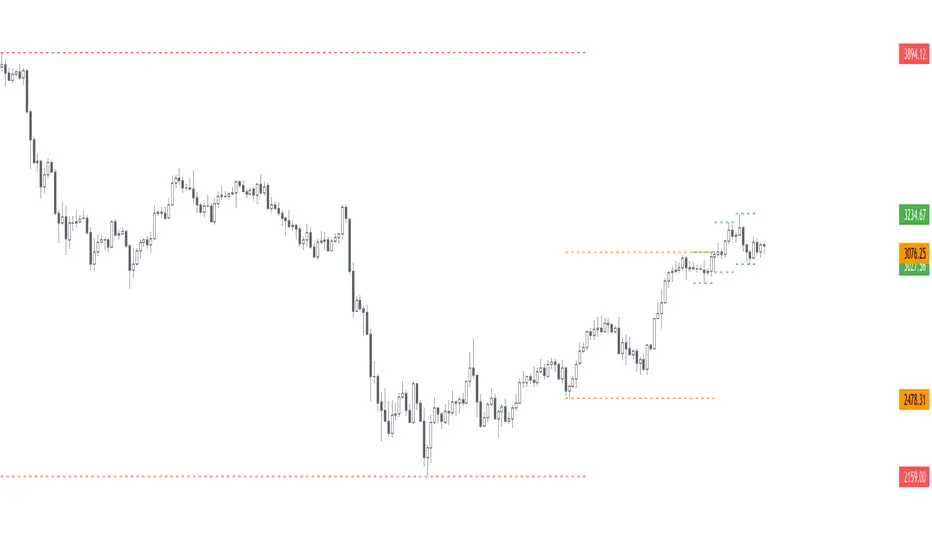
This script plots the previous n day and week highs and lows (previous two days and previous week by default).
Here are some additional info about the script behavior:
Here are some additional info about the script behavior:
- Plots highs and/or lows
- Plots for days and/or weeks
- Day highs and lows are shown only on intraday timeframes
- Week highs and lows are shown only on timeframes < weekly
リリースノート
- Add previous month(s) high(s) and low(s)
- Minor fixes and improvements
オープンソーススクリプト
TradingViewの精神に則り、このスクリプトの作者はコードをオープンソースとして公開してくれました。トレーダーが内容を確認・検証できるようにという配慮です。作者に拍手を送りましょう!無料で利用できますが、コードの再公開はハウスルールに従う必要があります。
🌟 Listed as "Trusted Pine Programmer"
👨💻 Coding services: sbtnc.dev/hire-pine-script-developer
🔒 Premium indicators: sbtnc.gumroad.com
☕️ Tip: buymeacoffee.com/sbtnc
👨💻 Coding services: sbtnc.dev/hire-pine-script-developer
🔒 Premium indicators: sbtnc.gumroad.com
☕️ Tip: buymeacoffee.com/sbtnc
免責事項
この情報および投稿は、TradingViewが提供または推奨する金融、投資、トレード、その他のアドバイスや推奨を意図するものではなく、それらを構成するものでもありません。詳細は利用規約をご覧ください。