OPEN-SOURCE SCRIPT
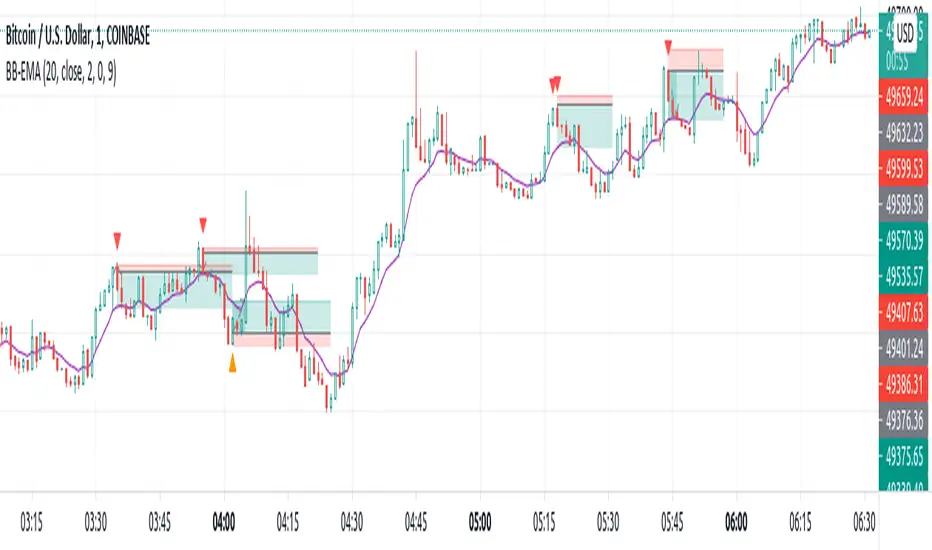
Bollinger bands + EMA

I discovered a video on YouTube which was published on Jan 22, 2021. I just coded on TradingView. It's performing better in smaller TimeFrames (1m, 5m, ...).
How does it work? How to use?
This is based on Bollinger Bands and Exponential Moving Average. The logic is so simple: It will wait until the a candle starts to poke out of the BB. When it figures out a price outside the band, it will be altered for next candle. If the next candle close back inside the band, it will be marked with a up triangle (for long positions) or down triangle (for short positions). The take profit level would be the Exponential Moving Average.
It can be used as a confirmation alongside other techno fundamental tools and analysis.
P.S. As it's prohibited by community rules to link to outside, while it seems to be a kind of advertisement, I cannot share the link to the video. Cheers to those creative and kind YouTubers!
オープンソーススクリプト
TradingViewの精神に則り、このスクリプトの作者はコードをオープンソースとして公開してくれました。トレーダーが内容を確認・検証できるようにという配慮です。作者に拍手を送りましょう!無料で利用できますが、コードの再公開はハウスルールに従う必要があります。
免責事項
この情報および投稿は、TradingViewが提供または推奨する金融、投資、トレード、その他のアドバイスや推奨を意図するものではなく、それらを構成するものでもありません。詳細は利用規約をご覧ください。
オープンソーススクリプト
TradingViewの精神に則り、このスクリプトの作者はコードをオープンソースとして公開してくれました。トレーダーが内容を確認・検証できるようにという配慮です。作者に拍手を送りましょう!無料で利用できますが、コードの再公開はハウスルールに従う必要があります。
免責事項
この情報および投稿は、TradingViewが提供または推奨する金融、投資、トレード、その他のアドバイスや推奨を意図するものではなく、それらを構成するものでもありません。詳細は利用規約をご覧ください。