OPEN-SOURCE SCRIPT
更新済 Dynamic Highest Lowest Moving Average
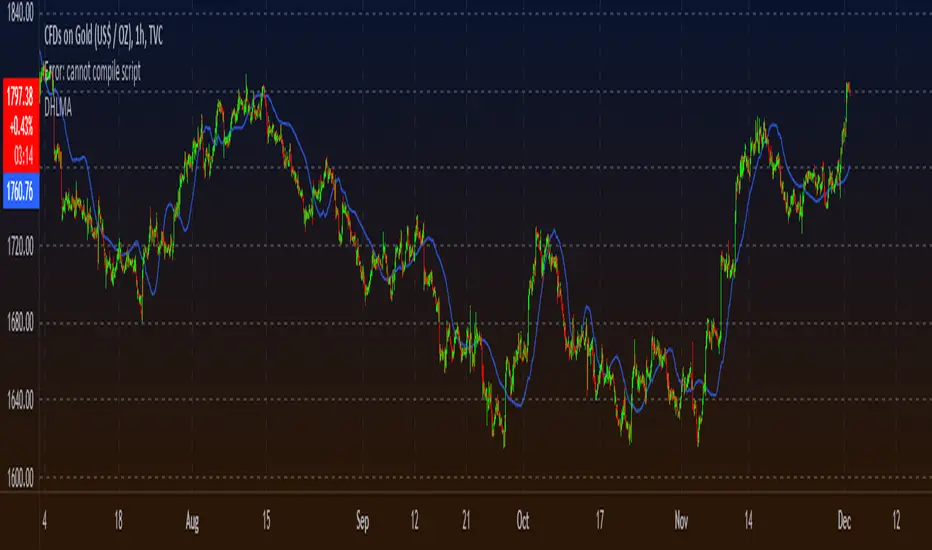
Similar to my last script, although this one uses the RSI value of
(highest high - price) / (price - lowest low)
to feed into the the logic creating the dynamic length. Choose how the length curve works by selecting either Incline, Decline, Peak or Trough.
Lastly select the moving average type to filter the result through to smoothen things out a bit
to find something that works for your strategy. This is useful as an entry/exit indicator along with other moving averages, or even just a standalone if you play with the settings enough.
リリースノート
Overlay = Trueリリースノート
Cleaned up, fix chart imageリリースノート
Added more thorough explanation of how we arrive at the average. Added ability to change the coeficcient, in how different each step up/down will be
Added option to include the current, or former price in the averaging of the highest/lowest values
オープンソーススクリプト
TradingViewの精神に則り、このスクリプトの作者はコードをオープンソースとして公開してくれました。トレーダーが内容を確認・検証できるようにという配慮です。作者に拍手を送りましょう!無料で利用できますが、コードの再公開はハウスルールに従う必要があります。
免責事項
この情報および投稿は、TradingViewが提供または推奨する金融、投資、トレード、その他のアドバイスや推奨を意図するものではなく、それらを構成するものでもありません。詳細は利用規約をご覧ください。
オープンソーススクリプト
TradingViewの精神に則り、このスクリプトの作者はコードをオープンソースとして公開してくれました。トレーダーが内容を確認・検証できるようにという配慮です。作者に拍手を送りましょう!無料で利用できますが、コードの再公開はハウスルールに従う必要があります。
免責事項
この情報および投稿は、TradingViewが提供または推奨する金融、投資、トレード、その他のアドバイスや推奨を意図するものではなく、それらを構成するものでもありません。詳細は利用規約をご覧ください。