OPEN-SOURCE SCRIPT
SC New high/low
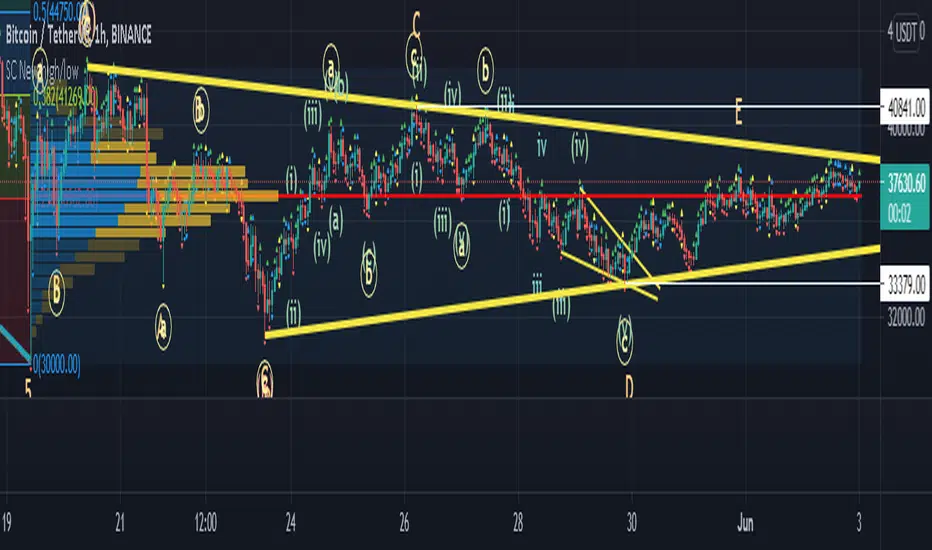
Plots a triangle above/below the candle/bar whenever the current one breaks the high or the low of the previous one.
A green triangle indicates the breakout of the previous high.
A red triangle indicates the breakout of the previous low.
Two yellow triangles (above and below the candle) indicate an Outside bar/candle.
Two blue triangles indicate an Inside bar/candle.
A green triangle indicates the breakout of the previous high.
A red triangle indicates the breakout of the previous low.
Two yellow triangles (above and below the candle) indicate an Outside bar/candle.
Two blue triangles indicate an Inside bar/candle.
オープンソーススクリプト
TradingViewの精神に則り、このスクリプトの作者はコードをオープンソースとして公開してくれました。トレーダーが内容を確認・検証できるようにという配慮です。作者に拍手を送りましょう!無料で利用できますが、コードの再公開はハウスルールに従う必要があります。
免責事項
この情報および投稿は、TradingViewが提供または推奨する金融、投資、トレード、その他のアドバイスや推奨を意図するものではなく、それらを構成するものでもありません。詳細は利用規約をご覧ください。
オープンソーススクリプト
TradingViewの精神に則り、このスクリプトの作者はコードをオープンソースとして公開してくれました。トレーダーが内容を確認・検証できるようにという配慮です。作者に拍手を送りましょう!無料で利用できますが、コードの再公開はハウスルールに従う必要があります。
免責事項
この情報および投稿は、TradingViewが提供または推奨する金融、投資、トレード、その他のアドバイスや推奨を意図するものではなく、それらを構成するものでもありません。詳細は利用規約をご覧ください。