OPEN-SOURCE SCRIPT
ICT Killzone Boxes
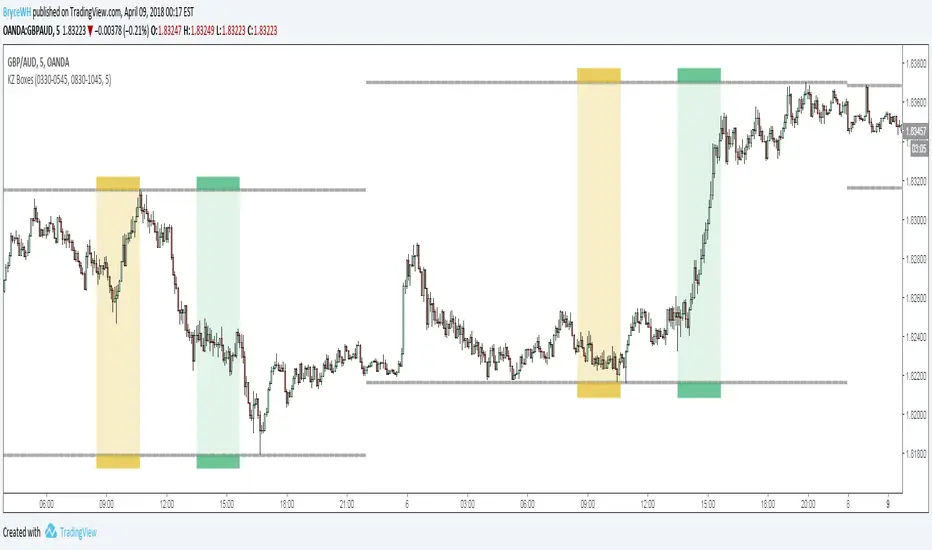
Plots London Open Killzone and New York Open Killzone as overlay boxes using current daily high / lows. Boxes verticle location will move as days range / high and low widens.
Middle fills can be turned on and off. Created this indicator because i didnt like highlighting the whole chart background as seen in other ICT Killzone indicators on tradingview and wanted something visually clearer.
If you want additional killzones such as london close / new york close, add the indicator to the chart twice.
Boxes height can be changed. Positive number puts the box outside current days high and low, negative number puts box inside current days high and low.
Adapted from Chris Moody's original indicator HLOC
Sorry for my ugly code. Presented as is - feel free to tweak / modify and change.
オープンソーススクリプト
TradingViewの精神に則り、このスクリプトの作者はコードをオープンソースとして公開してくれました。トレーダーが内容を確認・検証できるようにという配慮です。作者に拍手を送りましょう!無料で利用できますが、コードの再公開はハウスルールに従う必要があります。
免責事項
この情報および投稿は、TradingViewが提供または推奨する金融、投資、トレード、その他のアドバイスや推奨を意図するものではなく、それらを構成するものでもありません。詳細は利用規約をご覧ください。
オープンソーススクリプト
TradingViewの精神に則り、このスクリプトの作者はコードをオープンソースとして公開してくれました。トレーダーが内容を確認・検証できるようにという配慮です。作者に拍手を送りましょう!無料で利用できますが、コードの再公開はハウスルールに従う必要があります。
免責事項
この情報および投稿は、TradingViewが提供または推奨する金融、投資、トレード、その他のアドバイスや推奨を意図するものではなく、それらを構成するものでもありません。詳細は利用規約をご覧ください。