OPEN-SOURCE SCRIPT
MACD M4CD
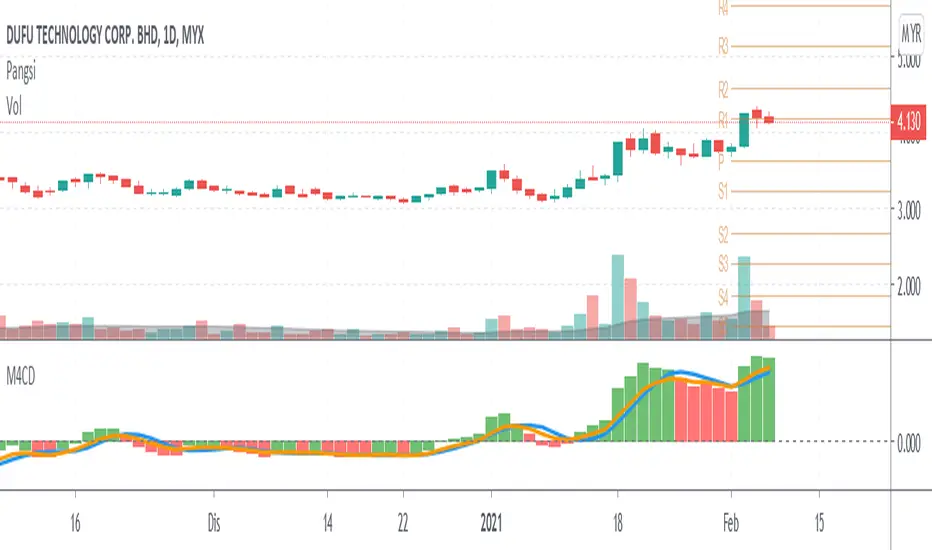
This script show:
1. Signal line base on sma blue color
2. Signal line base on ema orange color
3. Green bar mean current bar is high than signal line
4. Red bar mean current bar is low than signal line
if bar upper zero line, it show uptrend
if bar below zero line, it show downtrend
If orange line cross up blue line, it show signal buy.
If blue line cross down orange line, it show signal sell.
Combined it with other indicator you preferred such as support and resistant to avoid more noise.
The default setting is 5,20,5. (for short to midterm strategy)
my idea:
5 for five days in a week.
20 for twenty day in a month.
Thats all, hope benefit tou you all.
Thank you.
オープンソーススクリプト
TradingViewの精神に則り、このスクリプトの作者はコードをオープンソースとして公開してくれました。トレーダーが内容を確認・検証できるようにという配慮です。作者に拍手を送りましょう!無料で利用できますが、コードの再公開はハウスルールに従う必要があります。
免責事項
この情報および投稿は、TradingViewが提供または推奨する金融、投資、トレード、その他のアドバイスや推奨を意図するものではなく、それらを構成するものでもありません。詳細は利用規約をご覧ください。
オープンソーススクリプト
TradingViewの精神に則り、このスクリプトの作者はコードをオープンソースとして公開してくれました。トレーダーが内容を確認・検証できるようにという配慮です。作者に拍手を送りましょう!無料で利用できますが、コードの再公開はハウスルールに従う必要があります。
免責事項
この情報および投稿は、TradingViewが提供または推奨する金融、投資、トレード、その他のアドバイスや推奨を意図するものではなく、それらを構成するものでもありません。詳細は利用規約をご覧ください。