OPEN-SOURCE SCRIPT
Consecutive Lower Highs/Higher Lows v1 [tradinggeniusberlin]
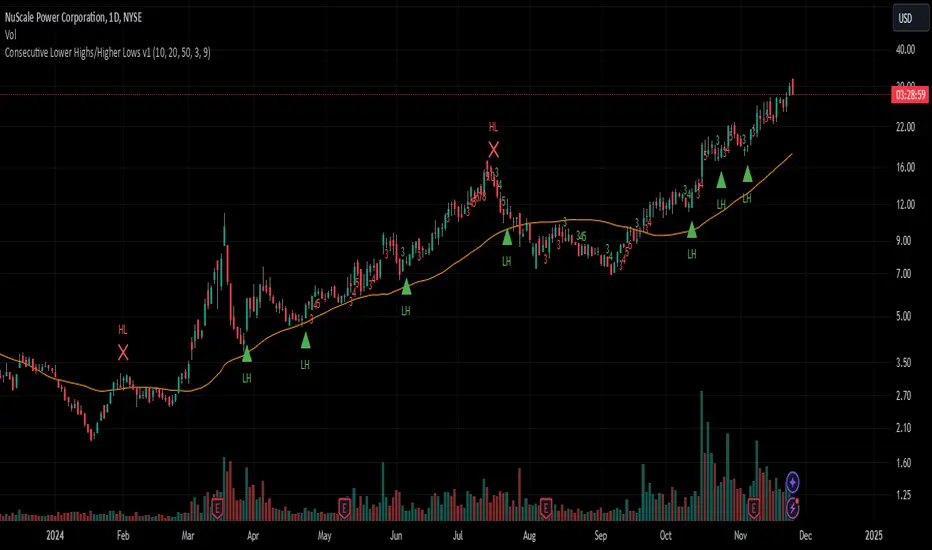
This indicator counts the lower highs and higher low streaks. If the streak is above a certain threshold a buy or exit arrow is shown.
Idea:
The probability of a reversal is rising the more lower highs the asset had already because if mean reversion tendencies of asset prices. Especially in uptrend above the 20ma and/or 50ma.
How to use it:
In Uptrends, lower high streak of 3 or more, enter at first new high.
Idea:
The probability of a reversal is rising the more lower highs the asset had already because if mean reversion tendencies of asset prices. Especially in uptrend above the 20ma and/or 50ma.
How to use it:
In Uptrends, lower high streak of 3 or more, enter at first new high.
オープンソーススクリプト
TradingViewの精神に則り、このスクリプトの作者はコードをオープンソースとして公開してくれました。トレーダーが内容を確認・検証できるようにという配慮です。作者に拍手を送りましょう!無料で利用できますが、コードの再公開はハウスルールに従う必要があります。
免責事項
この情報および投稿は、TradingViewが提供または推奨する金融、投資、トレード、その他のアドバイスや推奨を意図するものではなく、それらを構成するものでもありません。詳細は利用規約をご覧ください。
オープンソーススクリプト
TradingViewの精神に則り、このスクリプトの作者はコードをオープンソースとして公開してくれました。トレーダーが内容を確認・検証できるようにという配慮です。作者に拍手を送りましょう!無料で利用できますが、コードの再公開はハウスルールに従う必要があります。
免責事項
この情報および投稿は、TradingViewが提供または推奨する金融、投資、トレード、その他のアドバイスや推奨を意図するものではなく、それらを構成するものでもありません。詳細は利用規約をご覧ください。