OPEN-SOURCE SCRIPT
Kalman Supertrend (High vs Low) Bands by Skyito V2
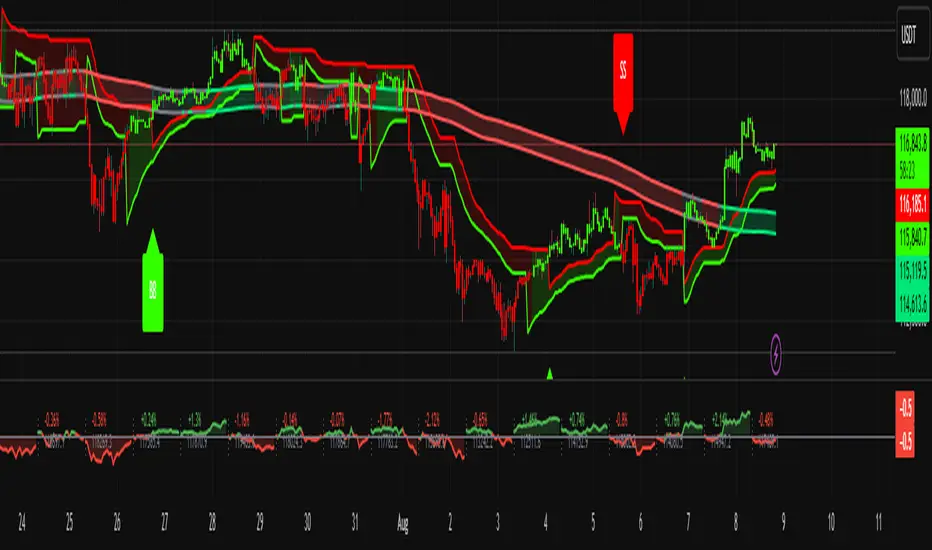
Inspired by BackQuant's Kalman Hull Supertrend, this upgraded version replaces the typical Kalman-close method with Kalman-filtered High and Low sources. This approach provides clearer trend visualization and helps confirm potential breakouts or reversals using clean, directional candle signals.
The core logic revolves around BB (Band Buy) and SS (Band Sell) signals:
BB appears only when a candle fully breaks above both Kalman High and Low bands.
SS appears when a candle fully breaks below both bands.
These clean triggers help avoid false signals and are excellent for capturing high-probability trend shifts.
✅ The Supertrend line is also included and can be toggled on or off — useful for those who prefer early trend detection or confirmation.
🆕 Why the SMA Band was Included
To complement the Kalman band system, a Moving Average Band (default: SMA 200) is added:
It helps detect the long-term trend direction.
Candles are colored green when above the SMA band and red when below.
This visual cue strengthens trend confidence and adds an extra layer for filtering trades.
The MA band and coloring can be turned on or off based on preference.
This tool is built for traders who want a clean trend-following and breakout confirmation system. It can be used as a standalone strategy or paired with price action, volume, or support/resistance tools.
オープンソーススクリプト
TradingViewの精神に則り、このスクリプトの作者はコードをオープンソースとして公開してくれました。トレーダーが内容を確認・検証できるようにという配慮です。作者に拍手を送りましょう!無料で利用できますが、コードの再公開はハウスルールに従う必要があります。
免責事項
この情報および投稿は、TradingViewが提供または推奨する金融、投資、トレード、その他のアドバイスや推奨を意図するものではなく、それらを構成するものでもありません。詳細は利用規約をご覧ください。
オープンソーススクリプト
TradingViewの精神に則り、このスクリプトの作者はコードをオープンソースとして公開してくれました。トレーダーが内容を確認・検証できるようにという配慮です。作者に拍手を送りましょう!無料で利用できますが、コードの再公開はハウスルールに従う必要があります。
免責事項
この情報および投稿は、TradingViewが提供または推奨する金融、投資、トレード、その他のアドバイスや推奨を意図するものではなく、それらを構成するものでもありません。詳細は利用規約をご覧ください。