INVITE-ONLY SCRIPT
更新済 Nexus Drift | Oquant
Overview
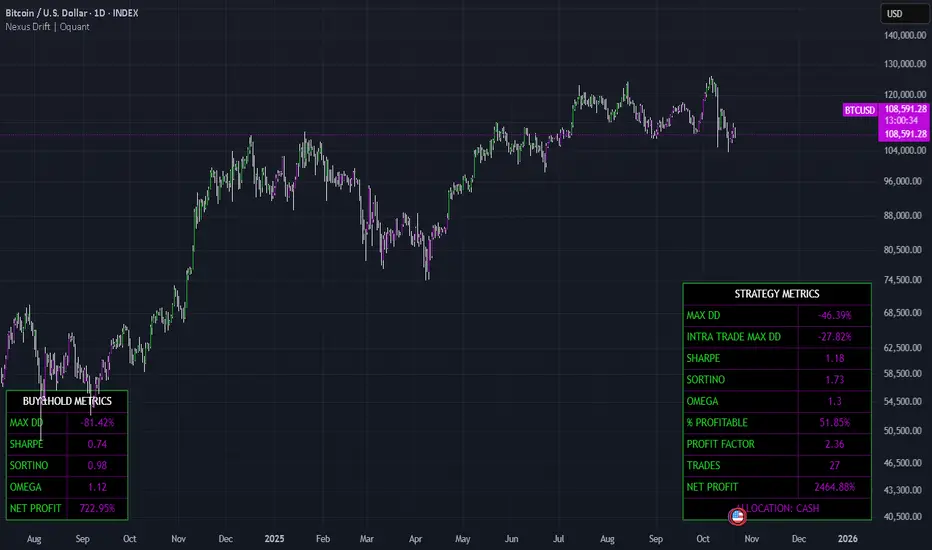
Nexus Drift is a consensus-based trend tool designed to identify potential long opportunities in trending markets by aggregating signals from multiple technical components. It generates a composite score from seven distinct trend-detection methods, triggering a "LONG" allocation when the score meets a predefined threshold, and shifting to "CASH" otherwise. The script also includes optional visualizations such as an equity curve and performance tables displaying key risk-adjusted metrics like Sharpe ratio, Sortino ratio, Omega ratio, maximum drawdown, and others for both the strategy and a buy-and-hold benchmark. This allows users to evaluate historical performance(remember past performance doesn’t guarantee future results) in a structured way. By combining diverse trend filters, the script aims to reduce noise and provide a more robust signal for trend-following approaches.
Key Factors/Components
The script incorporates seven complementary trend-detection components, each contributing to the overall consensus score:
MAD Median LSMA: A least-squares moving average filtered through a median and adjusted with median absolute deviation bands for outlier resistance.
Smoothed TEMA SD: A triple exponential moving average smoothed and bounded by standard deviation bands to capture trends without too much noise.
Z-Scored ALMA: An Arnaud legoux moving average normalized into a Z-score for trend strength assessment.
EMA Cross: A simple crossover between fast and slow exponential moving averages for basic trend direction.
RSI MA: A moving average of the Relative Strength Index to confirm bullish momentum in trends on a smoothed basis.
SMA SD SuperTrend: A SuperTrend variant using simple moving average and standard deviation for dynamic trailing levels.
WMA MAD Bands: A weighted moving average with median absolute deviation bands for weighted trend tracking with volatility adjustment.
How It Works
The script calculates individual signals from each component, assigning a value of +1 for long conditions, -1 for cash. These are averaged into a composite score, which triggers a long allocation if it meets or exceeds a threshold (0.5), or shifts to cash if equal or below a cash threshold (0). This consensus approach helps filter out conflicting signals, emphasizing agreement across methods to potentially improve reliability in sustained trends. Historical equity is simulated starting from a user-defined date, incorporating daily returns only during long allocations. Performance metrics are computed using standard formulas (e.g., Sharpe as average return over standard deviation, annualized; Sortino focusing on downside deviation; Omega as the ratio of sum positive to sum negative returns). Tables update in real-time on bar close on the chart for quick reference, but all calculations are based on historical data and do not predict future outcomes.
Recommended Use Cases
This script is best suited for trend-following traders or investors focusing on assets with strong directional moves, such as cryptocurrencies on daily or other timeframes. The tool's design was to work well in different markets and timeframes. It performs optimally in markets exhibiting prolonged trends rather than ranging, where consensus may lag or produce fewer/false signals. It is not ideal for short-term scalping, mean-reversion strategies, or assets with low liquidity, as the components are tuned for trend persistence.
Settings and Default Settings
The script includes several inputs for customization:
Strategy Start Date: Defines the backtesting start point (default: 1 Jan 2018). Use this to align with relevant historical periods, but note that shorter datasets may reduce metric reliability and also past performance doesn’t guarantee future results.
Show Strategy Metrics Table: Toggles the display of a table with metrics like max drawdown, intra-trade max drawdown, Sharpe, Sortino, Omega, percent profitable, profit factor, trades, and net profit (default: true).
Show Buy & Hold Table: Toggles a benchmark table with similar metrics for a passive buy-and-hold approach (default: true).
Plot Equity Curve: Displays the simulated strategy equity line (default: false).
Component-specific lengths and multipliers are fixed but chosen to balance responsiveness and smoothness across methods. The long threshold (0.5) requires the majority of the components to agree on a long signal. The script is optimized for daily crypto charts on trending assets, but tested on other timeframes/markets also.
Conclusion
Nexus Drift offers a structured way to gauge trend consensus through diversified components, providing actionable allocations and transparent metrics to support informed decision-making. By focusing on agreement across methods, it seeks to enhance trend detection while highlighting key performance metrics.
⚠️ Disclaimer: This indicator is intended for educational and informational purposes only. Trading/investing involves risk, and past performance does not guarantee future results. Always test and evaluate indicators/strategies before applying them in live markets. Use at your own risk.
リリースノート
Fixed a typo in the table招待専用スクリプト
こちらのスクリプトにアクセスできるのは投稿者が承認したユーザーだけです。投稿者にリクエストして使用許可を得る必要があります。通常の場合、支払い後に許可されます。詳細については、以下、作者の指示をお読みになるか、oquantに直接ご連絡ください。
スクリプトの機能を理解し、その作者を全面的に信頼しているのでなければ、お金を支払ってまでそのスクリプトを利用することをTradingViewとしては「非推奨」としています。コミュニティスクリプトの中で、その代わりとなる無料かつオープンソースのスクリプトを見つけられる可能性もあります。
作者の指示
Check our website for access.
https://oquantsystems.com
Get access to Oquant's premium tools.
oquantsystems.com
oquantsystems.com
免責事項
これらの情報および投稿は、TradingViewが提供または保証する金融、投資、取引、またはその他の種類のアドバイスや推奨を意図したものではなく、またそのようなものでもありません。詳しくは利用規約をご覧ください。
招待専用スクリプト
こちらのスクリプトにアクセスできるのは投稿者が承認したユーザーだけです。投稿者にリクエストして使用許可を得る必要があります。通常の場合、支払い後に許可されます。詳細については、以下、作者の指示をお読みになるか、oquantに直接ご連絡ください。
スクリプトの機能を理解し、その作者を全面的に信頼しているのでなければ、お金を支払ってまでそのスクリプトを利用することをTradingViewとしては「非推奨」としています。コミュニティスクリプトの中で、その代わりとなる無料かつオープンソースのスクリプトを見つけられる可能性もあります。
作者の指示
Check our website for access.
https://oquantsystems.com
Get access to Oquant's premium tools.
oquantsystems.com
oquantsystems.com
免責事項
これらの情報および投稿は、TradingViewが提供または保証する金融、投資、取引、またはその他の種類のアドバイスや推奨を意図したものではなく、またそのようなものでもありません。詳しくは利用規約をご覧ください。