OPEN-SOURCE SCRIPT
更新済 ADX and DI+ v4.5 Optimized
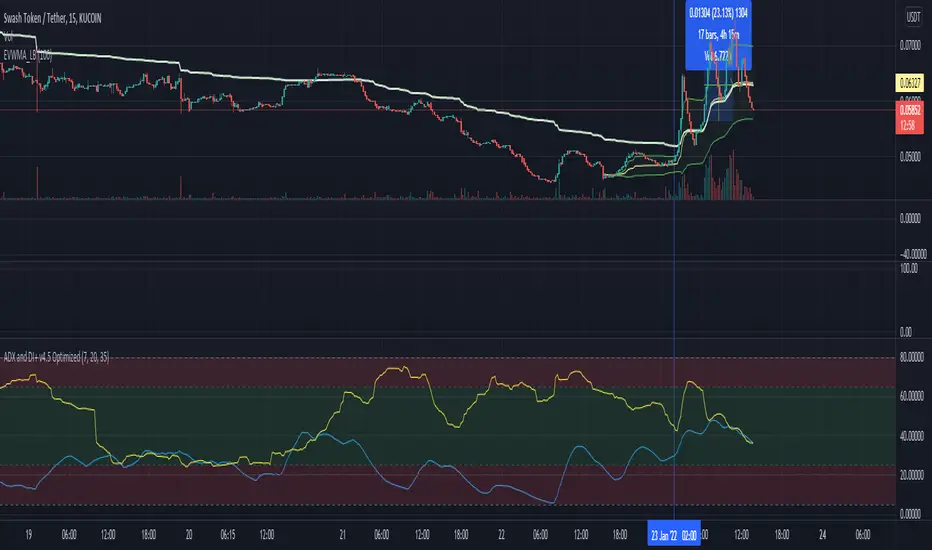
This script plots VWMA(ADX) vs EMA(DI+) under pre-set time frame.
Feature:
The Main Strategy is to look for potential BUY opportunity (Intraday trading, Session trading, Swing) when EMA(DI+) colored blue, entering upward into Green zone where ADX counterpart (default colored: Yellow) is also present.
Formula plot is also helpful to understand upcoming downtrend signal when both blue and yellow lines try to make diverted bifurcation like pattern on graph.
Disclaimer- This is an indicator script and not final Buy and Sell advice.
* Originally developed by © BeikabuOyaji and further extended & optimized by Bharat imbharat to serve above features
リリースノート
Some minor format corrections.Script is intact.
オープンソーススクリプト
TradingViewの精神に則り、このスクリプトの作者はコードをオープンソースとして公開してくれました。トレーダーが内容を確認・検証できるようにという配慮です。作者に拍手を送りましょう!無料で利用できますが、コードの再公開はハウスルールに従う必要があります。
免責事項
この情報および投稿は、TradingViewが提供または推奨する金融、投資、トレード、その他のアドバイスや推奨を意図するものではなく、それらを構成するものでもありません。詳細は利用規約をご覧ください。
オープンソーススクリプト
TradingViewの精神に則り、このスクリプトの作者はコードをオープンソースとして公開してくれました。トレーダーが内容を確認・検証できるようにという配慮です。作者に拍手を送りましょう!無料で利用できますが、コードの再公開はハウスルールに従う必要があります。
免責事項
この情報および投稿は、TradingViewが提供または推奨する金融、投資、トレード、その他のアドバイスや推奨を意図するものではなく、それらを構成するものでもありません。詳細は利用規約をご覧ください。