OPEN-SOURCE SCRIPT
Gradiente
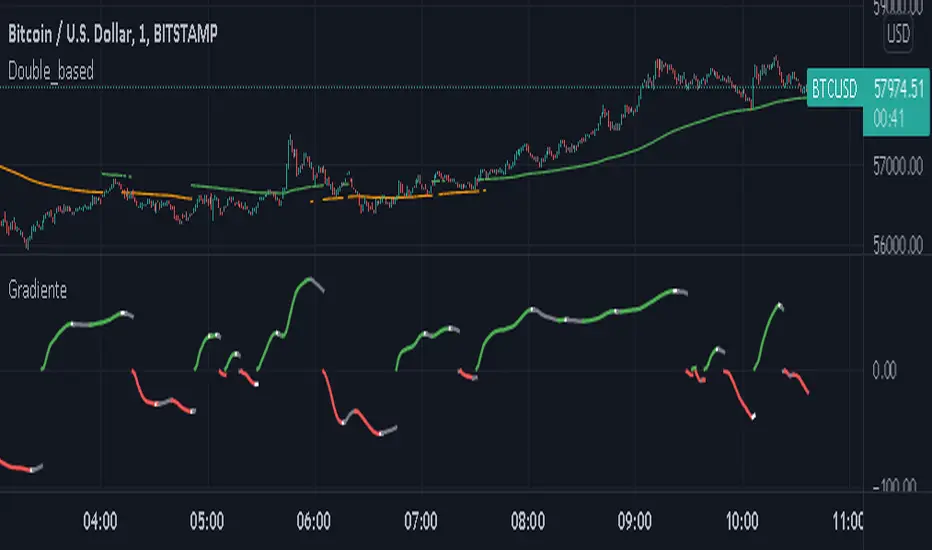
This indicator works in following concep. In a trend the area between two EMA increases as the trend go forward. When the trend loose strenth the fast EMA is the first to slow down and the area betwenn the EMA stop to increase indicating a lost of momentum.
The gradient is the division of the area formed between the EMA by the number of bars it contains.
In a up-trend is above 0.
In a down-trend is below 0.
The color green in the up trend shows the strenth is on, the white color shows the momentum is weaking.
The color red in the down trend shows the strenth is on, the white color shows the momentum is weaking.
Is necessary to plot the same EMA periods on the chart price to compare the strenth.
オープンソーススクリプト
TradingViewの精神に則り、このスクリプトの作者はコードをオープンソースとして公開してくれました。トレーダーが内容を確認・検証できるようにという配慮です。作者に拍手を送りましょう!無料で利用できますが、コードの再公開はハウスルールに従う必要があります。
免責事項
この情報および投稿は、TradingViewが提供または推奨する金融、投資、トレード、その他のアドバイスや推奨を意図するものではなく、それらを構成するものでもありません。詳細は利用規約をご覧ください。
オープンソーススクリプト
TradingViewの精神に則り、このスクリプトの作者はコードをオープンソースとして公開してくれました。トレーダーが内容を確認・検証できるようにという配慮です。作者に拍手を送りましょう!無料で利用できますが、コードの再公開はハウスルールに従う必要があります。
免責事項
この情報および投稿は、TradingViewが提供または推奨する金融、投資、トレード、その他のアドバイスや推奨を意図するものではなく、それらを構成するものでもありません。詳細は利用規約をご覧ください。