OPEN-SOURCE SCRIPT
更新済 YCGH Drawdown Percentiles
What This Indicator Does?
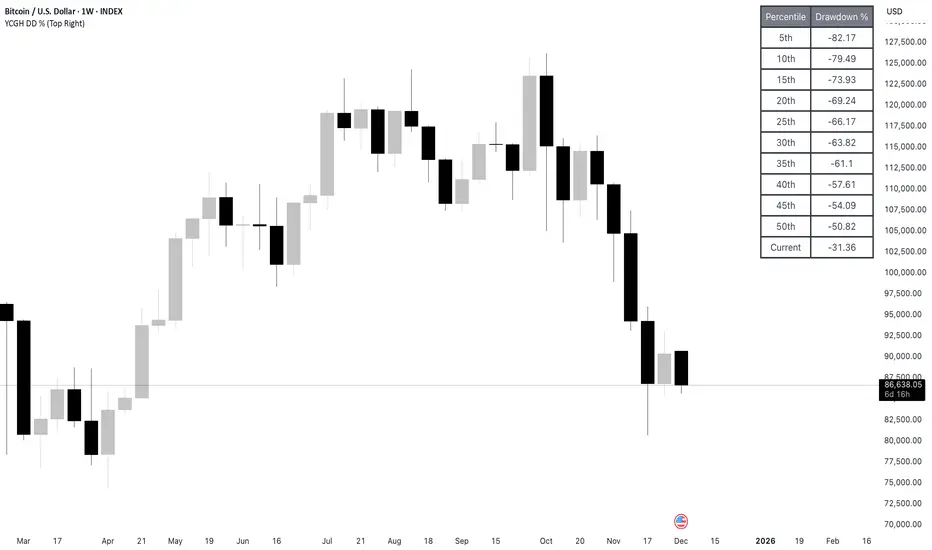
The Drawdown Percentiles indicator tracks how far below the all-time high (ATH) a stock or asset is currently trading, then displays statistical percentiles of historical drawdowns in a customizable table.
Percentile Analysis: It collects up to 5,000 historical bars of drawdown data, sorts them, and calculates user-selected percentiles (default: 10th, 30th, 50th) to show where current drawdowns rank historically.
Visual Display: A table shows each percentile threshold with color-coded drawdown values, helping you quickly assess whether the current drawdown is typical or extreme compared to historical patterns.
Practical Use Cases
Risk Assessment: Identify if current drawdowns fall within normal ranges or represent extreme conditions requiring position adjustments.
Entry/Exit Timing: Use percentile rankings to time entries during historically shallow drawdowns (better conditions) and reduce exposure during deep drawdowns.
Strategy Comparison: Compare drawdown patterns across different assets or trading strategies to evaluate risk-adjusted performance.
リリースノート
updated tableリリースノート
logic updatedリリースノート
updated Tableリリースノート
removed linesリリースノート
table made fancyリリースノート
Summary of Functional Changes:Fixed 10 percentiles instead of 3 customizable ones
Complete percentile calculation logic that actually works
Full table border on all sides (frame)
Individual color customization for each percentile level
Current drawdown display as the last row
Visual ATH reference on the chart
Proper data storage in array for historical analysis
オープンソーススクリプト
TradingViewの精神に則り、このスクリプトの作者はコードをオープンソースとして公開してくれました。トレーダーが内容を確認・検証できるようにという配慮です。作者に拍手を送りましょう!無料で利用できますが、コードの再公開はハウスルールに従う必要があります。
YCGH Capital
免責事項
この情報および投稿は、TradingViewが提供または推奨する金融、投資、トレード、その他のアドバイスや推奨を意図するものではなく、それらを構成するものでもありません。詳細は利用規約をご覧ください。
オープンソーススクリプト
TradingViewの精神に則り、このスクリプトの作者はコードをオープンソースとして公開してくれました。トレーダーが内容を確認・検証できるようにという配慮です。作者に拍手を送りましょう!無料で利用できますが、コードの再公開はハウスルールに従う必要があります。
YCGH Capital
免責事項
この情報および投稿は、TradingViewが提供または推奨する金融、投資、トレード、その他のアドバイスや推奨を意図するものではなく、それらを構成するものでもありません。詳細は利用規約をご覧ください。