OPEN-SOURCE SCRIPT
更新済 Intra-Candles
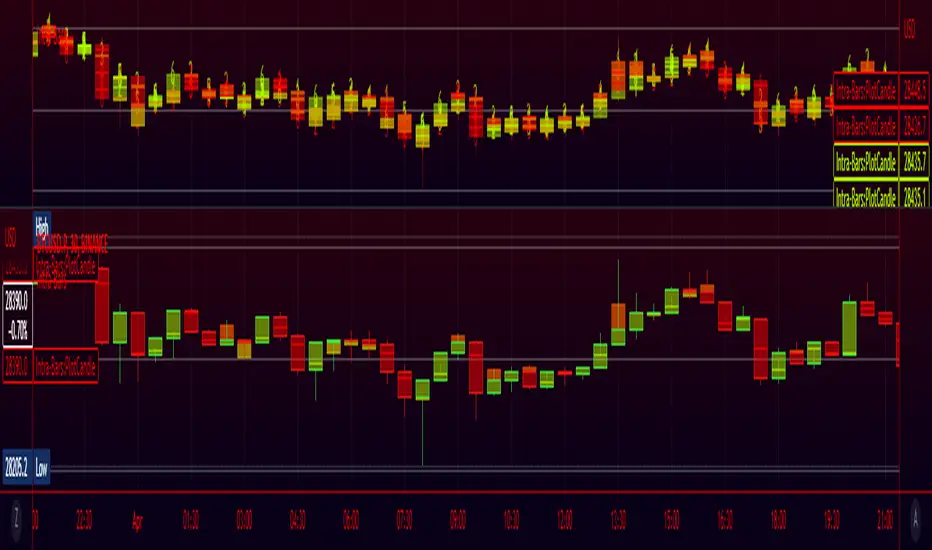
*For use with <=24 hour Hollow Candles *
Indicator for more informative candle plotting. Select from 2-6 lower timeframe candles and view the price action of the lower bars within the normal chart's candles. Plotting short time frame candles with a semi-transparent body lets you see reversals that occurred during the larger candle's formation. Use the information provided to inform your own trading decisions.
Indicator for more informative candle plotting. Select from 2-6 lower timeframe candles and view the price action of the lower bars within the normal chart's candles. Plotting short time frame candles with a semi-transparent body lets you see reversals that occurred during the larger candle's formation. Use the information provided to inform your own trading decisions.
リリースノート
Lower timeframe is selected according to the current timeframe.multiplier value divided by the "# of Lower Timeframe Candles" selected in settings. Check if array size is large enough then get the closing value using array.get for each value inside of the IntraBar array.
The first Intra Bar is plotted with the same opening value as the higher timeframe candle and the first value from the array
is used as it's close which also marks the beginning of a new Intra-Bar with the next value in the array, continue this
process for each Intra-bar value inside of the array.
リリースノート
Updated plotcandle(o,h,l,c) values to use high and low values aswell リリースノート
Fixed timeframe auto selection method to more intelligently select between minutes, hours, days, weeks and months.オープンソーススクリプト
TradingViewの精神に則り、このスクリプトの作者はコードをオープンソースとして公開してくれました。トレーダーが内容を確認・検証できるようにという配慮です。作者に拍手を送りましょう!無料で利用できますが、コードの再公開はハウスルールに従う必要があります。
免責事項
この情報および投稿は、TradingViewが提供または推奨する金融、投資、トレード、その他のアドバイスや推奨を意図するものではなく、それらを構成するものでもありません。詳細は利用規約をご覧ください。
オープンソーススクリプト
TradingViewの精神に則り、このスクリプトの作者はコードをオープンソースとして公開してくれました。トレーダーが内容を確認・検証できるようにという配慮です。作者に拍手を送りましょう!無料で利用できますが、コードの再公開はハウスルールに従う必要があります。
免責事項
この情報および投稿は、TradingViewが提供または推奨する金融、投資、トレード、その他のアドバイスや推奨を意図するものではなく、それらを構成するものでもありません。詳細は利用規約をご覧ください。