OPEN-SOURCE SCRIPT
US Presidents 1789–1916
Description:
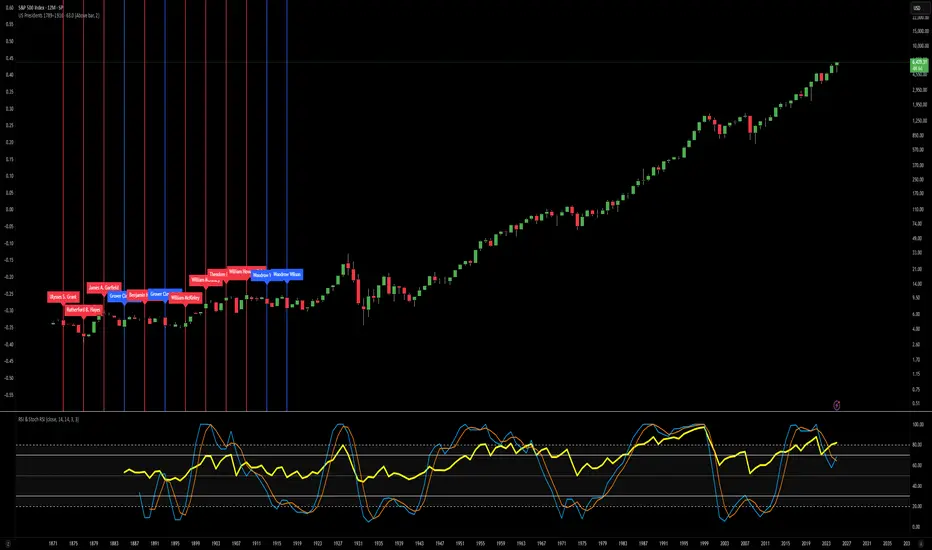
This indicator displays all U.S. presidential elections from 1789 to 1916 on your chart.
Features:
Vertical lines at the date of each presidential election.
Line color by party:
Red = Republican
Blue = Democrat
Gray = Other/None
Labels showing the name of each president.
Historical flag style: All presidents before 1900 are considered historical, providing visual distinction.
Fully overlayed on the price chart for timeline context.
Customizable: Label position (above/below bar) and line width.
Use case: Great for studying historical market behavior around elections or for general reference of U.S. presidents during the early history of the country.
オープンソーススクリプト
TradingViewの精神に則り、このスクリプトの作者はコードをオープンソースとして公開してくれました。トレーダーが内容を確認・検証できるようにという配慮です。作者に拍手を送りましょう!無料で利用できますが、コードの再公開はハウスルールに従う必要があります。
免責事項
この情報および投稿は、TradingViewが提供または推奨する金融、投資、トレード、その他のアドバイスや推奨を意図するものではなく、それらを構成するものでもありません。詳細は利用規約をご覧ください。
オープンソーススクリプト
TradingViewの精神に則り、このスクリプトの作者はコードをオープンソースとして公開してくれました。トレーダーが内容を確認・検証できるようにという配慮です。作者に拍手を送りましょう!無料で利用できますが、コードの再公開はハウスルールに従う必要があります。
免責事項
この情報および投稿は、TradingViewが提供または推奨する金融、投資、トレード、その他のアドバイスや推奨を意図するものではなく、それらを構成するものでもありません。詳細は利用規約をご覧ください。