OPEN-SOURCE SCRIPT
更新済 Elliott Wave Analysis

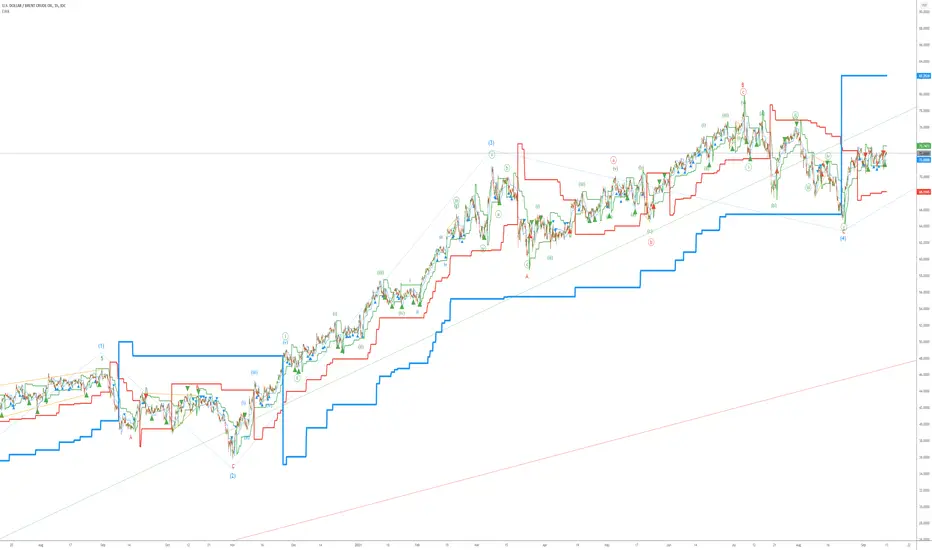
Initially, Elliott wave analysis is designed to simplify and increase the objectivity of graph analysis using the Elliott method. Probably, this indicator can be successfully used in trading without knowing the Elliott method.
The indicator is based on a supertrend. Supertrends are built in accordance with the Fibonacci grid. The degree of waves in the indicator settings corresponds to a 1-hour timeframe - this is the main mode of working with the indicator. I also recommend using weekly (for evaluating large movements) and 1-minute timeframes.
When using other timeframes, the baseline of the indicator will correspond to:
1 min-Submicro
5 minutes-Micro
15 minutes-Subminuette
1 hour-Minuette
4 hours-Minute
Day-Minor
Week-Intermediate
Month-Primary
Those who are well versed in the Elliott method can see that the waves fall on the indicator almost perfectly. To demonstrate this, I put the markup on the graph
リリースノート
Added 3 levels of trading signals. The entry is carried out on a correction, counting on the resumption of the trend. The color of the signal corresponds to this trend.リリースノート
Added a pair of Minuette signals. Added filters for all signals: rejected signals on too fast and too slow trendリリースノート
Filtering is now optionalリリースノート
The filter has been changed. Now only signals that are very far from the old trend line are rejectedリリースノート
All blue signals directed against the red trend have been removedリリースノート
-- The visualization of signals has been changed -- The indicator colors are now tied to the degrees of the waves, regardless of the timeframe. For example, for Line 1(the fastest indicator line) for different timeframes, the colors (by default) will be as follows:
1 min-Submicro blue
5 minutes-Micro green
15 minutes-Subminuette red
1 hour-Minuette blue
4 hours-Minute green
Day-Minor red
Week-Intermediate blue
Month-Primary green
リリースノート
-- The script is adapted for version 5 of the Pine editor-- Added line 0, which participates in the formation of sell1/buy1 signals. By default, it is not displayed
-- Lines 4 and 5 are now not displayed by default for ease of perception
オープンソーススクリプト
TradingViewの精神に則り、このスクリプトの作者はコードをオープンソースとして公開してくれました。トレーダーが内容を確認・検証できるようにという配慮です。作者に拍手を送りましょう!無料で利用できますが、コードの再公開はハウスルールに従う必要があります。
免責事項
この情報および投稿は、TradingViewが提供または推奨する金融、投資、トレード、その他のアドバイスや推奨を意図するものではなく、それらを構成するものでもありません。詳細は利用規約をご覧ください。
オープンソーススクリプト
TradingViewの精神に則り、このスクリプトの作者はコードをオープンソースとして公開してくれました。トレーダーが内容を確認・検証できるようにという配慮です。作者に拍手を送りましょう!無料で利用できますが、コードの再公開はハウスルールに従う必要があります。
免責事項
この情報および投稿は、TradingViewが提供または推奨する金融、投資、トレード、その他のアドバイスや推奨を意図するものではなく、それらを構成するものでもありません。詳細は利用規約をご覧ください。