OPEN-SOURCE SCRIPT
GLB — Green Line Breakout Indicator (v6)
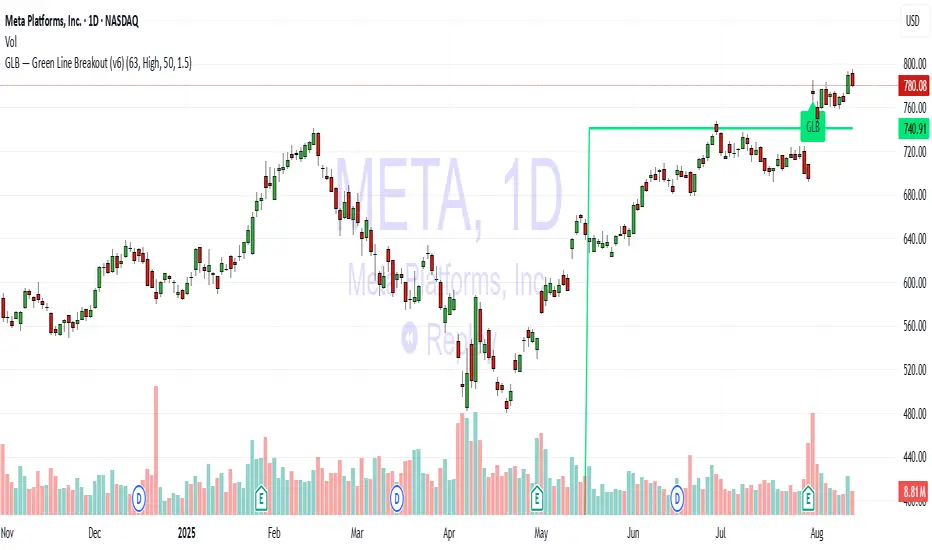
Understanding the GLB Strategy
According to Dr. Wish:
• GLB identifies stocks that hit a new all time high (ATH) and then consolidated (i.e., did not close above that high) for at least three months, forming what he calls the "green line."
• A breakout occurs when the stock closes above that green line level, often confirming strong buying interest and momentum (wishingwealthblog.com, wishingwealthblog.com).
オープンソーススクリプト
TradingViewの精神に則り、このスクリプトの作者はコードをオープンソースとして公開してくれました。トレーダーが内容を確認・検証できるようにという配慮です。作者に拍手を送りましょう!無料で利用できますが、コードの再公開はハウスルールに従う必要があります。
免責事項
この情報および投稿は、TradingViewが提供または推奨する金融、投資、トレード、その他のアドバイスや推奨を意図するものではなく、それらを構成するものでもありません。詳細は利用規約をご覧ください。
オープンソーススクリプト
TradingViewの精神に則り、このスクリプトの作者はコードをオープンソースとして公開してくれました。トレーダーが内容を確認・検証できるようにという配慮です。作者に拍手を送りましょう!無料で利用できますが、コードの再公開はハウスルールに従う必要があります。
免責事項
この情報および投稿は、TradingViewが提供または推奨する金融、投資、トレード、その他のアドバイスや推奨を意図するものではなく、それらを構成するものでもありません。詳細は利用規約をご覧ください。