OPEN-SOURCE SCRIPT
Range Percent Histogram

📌 Range Percent Histogram – Indicator Description
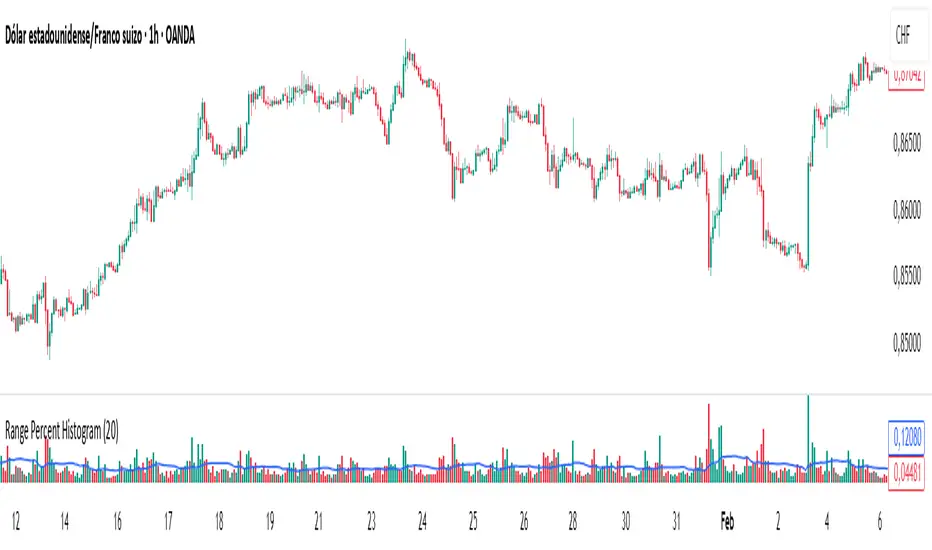
The Range Percent Histogram is a custom indicator that behaves like a traditional volume histogram, but instead of showing traded volume it displays the percentage range of each candle.
In other words, the height of each bar represents how much the price moved (in percentage terms) within that candle, from its low to its high.
🔧 What it shows
The indicator has two main components:
Component Description
Histogram Bars Columns plotted in red or green depending on the candle direction (green = bullish candle, red = bearish). The height of each bar = (high - low) / low * 100. That means a candle that moved, for example, 1 % from its lowest point to its highest point will show a bar with 1 % height.
Moving Average (optional) A 20-period Simple Moving Average applied directly to the bar values. It can be turned ON/OFF via a checkbox and helps you detect whether current range activity is above or below the average range of the past candles.
⚙️ How it works
Every time a new candle closes, the indicator calculates its range and converts it into a percentage.
This value is drawn as a column under the chart.
If the closing price is above the opening price → the bar is green (bullish range).
If the closing price is below the opening price → the bar is red (bearish range).
When the Show Moving Average option is enabled, a smooth line is plotted on top of the histogram representing the average percentage range of the last 20 candles.
📈 How to use it
This indicator is very helpful for detecting moments of range expansion or contraction.
One powerful way to use it is similar to a volume exhaustion / low-volume pattern:
Situation Interpretation
Consecutive bars with very low height Price is in a period of low volatility → possible accumulation or "pause" phase.
A sudden large bar after a series of small ones Indicates a strong pickup in volatility → often marks the start of a new impulse in the direction of the breakout.
オープンソーススクリプト
TradingViewの精神に則り、このスクリプトの作者はコードをオープンソースとして公開してくれました。トレーダーが内容を確認・検証できるようにという配慮です。作者に拍手を送りましょう!無料で利用できますが、コードの再公開はハウスルールに従う必要があります。
免責事項
この情報および投稿は、TradingViewが提供または推奨する金融、投資、トレード、その他のアドバイスや推奨を意図するものではなく、それらを構成するものでもありません。詳細は利用規約をご覧ください。
オープンソーススクリプト
TradingViewの精神に則り、このスクリプトの作者はコードをオープンソースとして公開してくれました。トレーダーが内容を確認・検証できるようにという配慮です。作者に拍手を送りましょう!無料で利用できますが、コードの再公開はハウスルールに従う必要があります。
免責事項
この情報および投稿は、TradingViewが提供または推奨する金融、投資、トレード、その他のアドバイスや推奨を意図するものではなく、それらを構成するものでもありません。詳細は利用規約をご覧ください。