PROTECTED SOURCE SCRIPT
更新済 Trend Performance Tracker
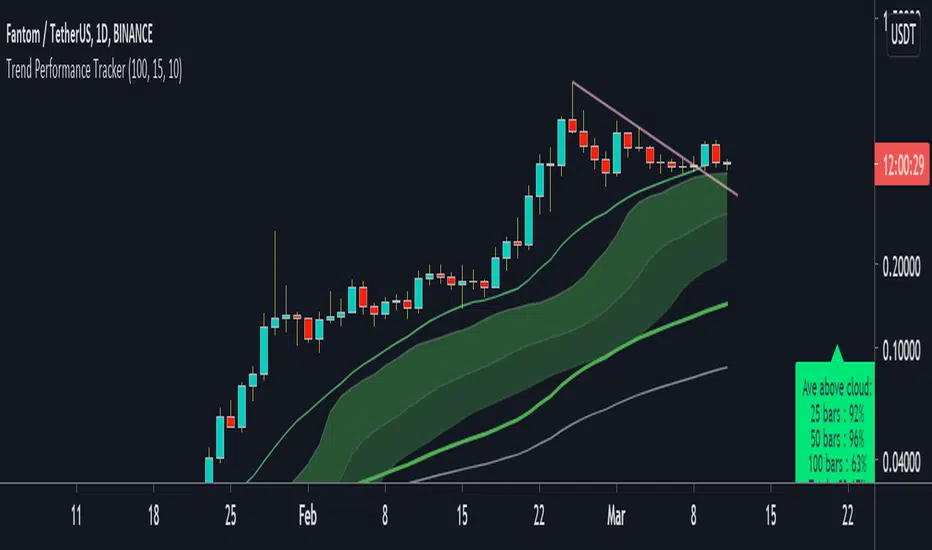
This script is designed for trend trading. Currently set up for stocks long. It's main aim is checking the profitability of the trend trading system that it suggests.
How to use:
- When there is a sufficient trend and pullback for an entry yellow dots will appear under the bars. An buy-stop line (green) and a stop-loss line (red) also appear on the chart at this point.
- the script tracks having made a trade and continues to draw the stop-loss placement on the chart (red line)
- at the bottom of the chart you an see the script tracking the trades it would place.
- Yellow squares are a pending setup
- A green arrow and green squares are a open position
- A pink X means a losing trade and a green flag means a winning trade
- At the current bar will be data on how well the strategy would perform on that pair at that timeframe. "RR" is the total RR made over the number of trades (a bad trade is counted as -1). "win %" is the percentage of winning trades.
- If there RR is > 2 and win % is > 50%, the data box will show as green, indicating a good probability for trading success on that pair and time-frame at that moment.
リリースノート
Updated the study name to avoid confusionリリースノート
Minor fix to entryリリースノート
Updated the RR data box to be out of the way. The X axis bar placement can be set in the options tooリリースノート
Improved the stop-loss line rulesリリースノート
Improved trend data to include trend strength and added higher timeframe masリリースノート
Updated pullback rulesリリースノート
Updated stop loss to not kick out on the first candleリリースノート
Updated to include short trend trackingリリースノート
Fixed sell line updateリリースノート
Removed entry circles as were clutterリリースノート
updated to show buy line at last 10 candlesリリースノート
Minor editリリースノート
cleaned up scriptリリースノート
fixed some small detailsリリースノート
Removes swing high line as not really useful保護スクリプト
このスクリプトのソースコードは非公開で投稿されています。 ただし、制限なく自由に使用できます – 詳細はこちらでご確認ください。
免責事項
この情報および投稿は、TradingViewが提供または推奨する金融、投資、トレード、その他のアドバイスや推奨を意図するものではなく、それらを構成するものでもありません。詳細は利用規約をご覧ください。
保護スクリプト
このスクリプトのソースコードは非公開で投稿されています。 ただし、制限なく自由に使用できます – 詳細はこちらでご確認ください。
免責事項
この情報および投稿は、TradingViewが提供または推奨する金融、投資、トレード、その他のアドバイスや推奨を意図するものではなく、それらを構成するものでもありません。詳細は利用規約をご覧ください。