OPEN-SOURCE SCRIPT
Fibonacci Moving Average
Simple idea from an article I read online I decided to code:
Take EMA's for periods based on the fibonacci sequence - 3, 5, 8, 13, 21, 34, 55 etc. and average them into one MA - the result is the Fibonacci MA (FMA)
Therefore - note the FMA does not use Length - but Range/Interval of how many steps of the Fibonacci Sequence to include.
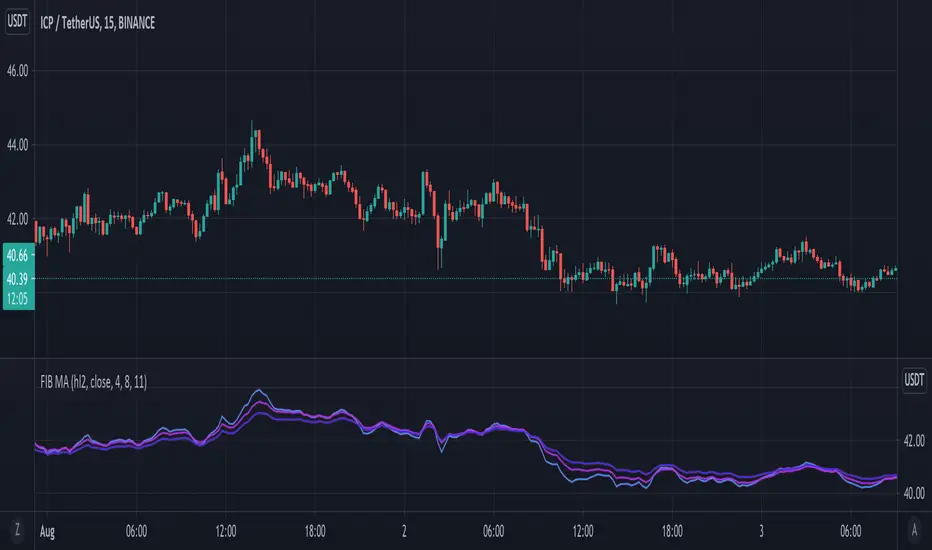
Seems to be good for finding support/resistance for the price - so added some extra features:
Using up to 3 in at different periods - when they stretch apart it means price is very deviated and will reverse.
Added a price OHLC line if you want to move the indicator to a sub-panel for nice visualisation.
I believe you could look at the 4, 8 and 10, where the longest MA (10,11 FMA) indicates overall bull or bear trend (whether on top or bottom) and you could probably code in alerts for price crossing up or crossing down on the faster (4 FMA)
Take EMA's for periods based on the fibonacci sequence - 3, 5, 8, 13, 21, 34, 55 etc. and average them into one MA - the result is the Fibonacci MA (FMA)
Therefore - note the FMA does not use Length - but Range/Interval of how many steps of the Fibonacci Sequence to include.
Seems to be good for finding support/resistance for the price - so added some extra features:
Using up to 3 in at different periods - when they stretch apart it means price is very deviated and will reverse.
Added a price OHLC line if you want to move the indicator to a sub-panel for nice visualisation.
I believe you could look at the 4, 8 and 10, where the longest MA (10,11 FMA) indicates overall bull or bear trend (whether on top or bottom) and you could probably code in alerts for price crossing up or crossing down on the faster (4 FMA)
オープンソーススクリプト
TradingViewの精神に則り、このスクリプトの作者はコードをオープンソースとして公開してくれました。トレーダーが内容を確認・検証できるようにという配慮です。作者に拍手を送りましょう!無料で利用できますが、コードの再公開はハウスルールに従う必要があります。
免責事項
この情報および投稿は、TradingViewが提供または推奨する金融、投資、トレード、その他のアドバイスや推奨を意図するものではなく、それらを構成するものでもありません。詳細は利用規約をご覧ください。
オープンソーススクリプト
TradingViewの精神に則り、このスクリプトの作者はコードをオープンソースとして公開してくれました。トレーダーが内容を確認・検証できるようにという配慮です。作者に拍手を送りましょう!無料で利用できますが、コードの再公開はハウスルールに従う必要があります。
免責事項
この情報および投稿は、TradingViewが提供または推奨する金融、投資、トレード、その他のアドバイスや推奨を意図するものではなく、それらを構成するものでもありません。詳細は利用規約をご覧ください。