OPEN-SOURCE SCRIPT
更新済 Glowing RSI Candlesticks (With Buy and Sell helpers)
This is not your average, boring RSI indicator.
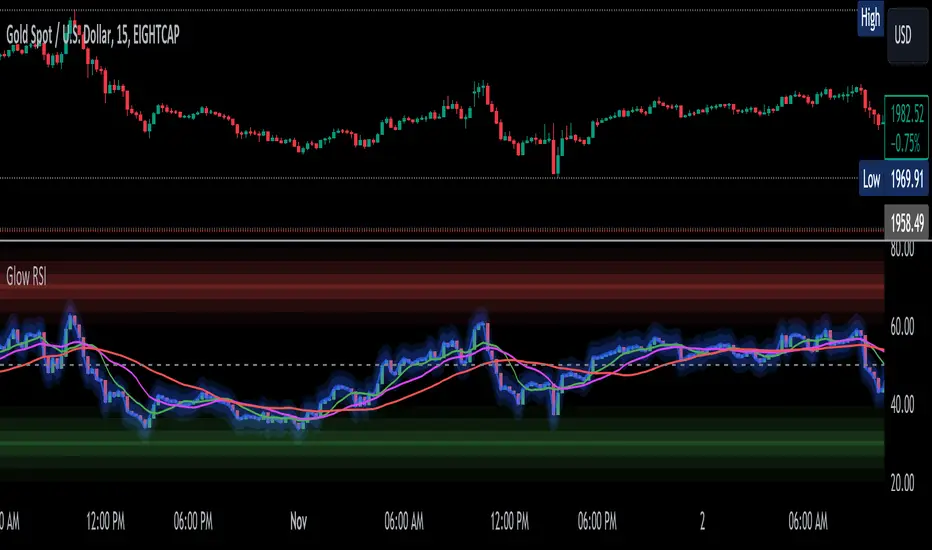
This indicator is still an RSI (momentum) indicator, but I have converted the line into candlesticks.
It has an option to make it glow neon blue to make it look cooler (dark background recommended for full effect).
There is a red zone at 70, because of course, and a green zone at 30 for the same reason.
On top of that, it has triple moving averages, two of which it uses to create some simple buy and sell indications (the vertical green and red lines).
Enjoy! :)
リリースノート
- I got rid of the vertical lines (buy and sell helpers) since they were really just based on a strategy that cluttered the indicator more than provide anything of any value, at least in most cases. オープンソーススクリプト
TradingViewの精神に則り、このスクリプトの作者はコードをオープンソースとして公開してくれました。トレーダーが内容を確認・検証できるようにという配慮です。作者に拍手を送りましょう!無料で利用できますが、コードの再公開はハウスルールに従う必要があります。
免責事項
この情報および投稿は、TradingViewが提供または推奨する金融、投資、トレード、その他のアドバイスや推奨を意図するものではなく、それらを構成するものでもありません。詳細は利用規約をご覧ください。
オープンソーススクリプト
TradingViewの精神に則り、このスクリプトの作者はコードをオープンソースとして公開してくれました。トレーダーが内容を確認・検証できるようにという配慮です。作者に拍手を送りましょう!無料で利用できますが、コードの再公開はハウスルールに従う必要があります。
免責事項
この情報および投稿は、TradingViewが提供または推奨する金融、投資、トレード、その他のアドバイスや推奨を意図するものではなく、それらを構成するものでもありません。詳細は利用規約をご覧ください。