OPEN-SOURCE SCRIPT
X21
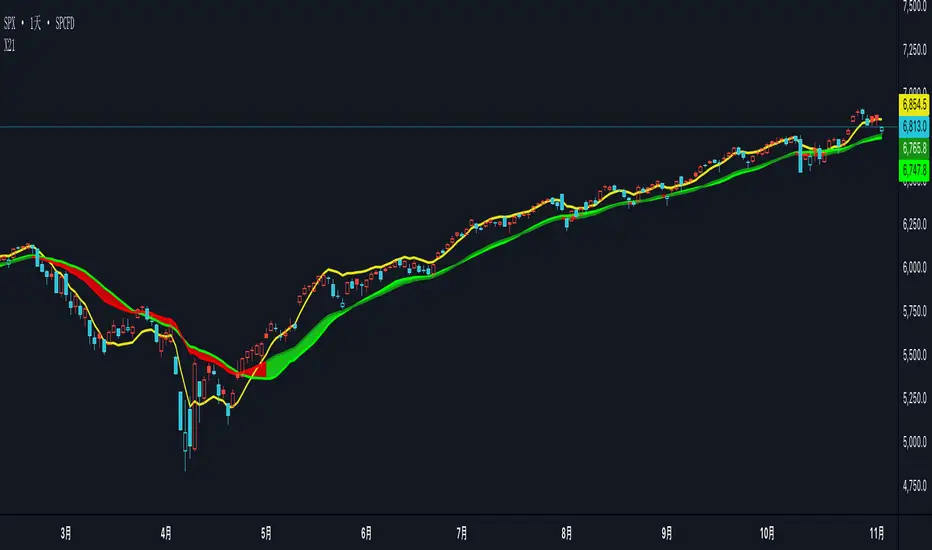
The X21 Dynamic Trend Indicator is an adaptive moving average system that combines SMA, EMA, and TEMA to provide real-time trend identification with dynamic color coding. This indicator automatically adjusts its visual presentation based on market conditions, making trend recognition intuitive and immediate.
Key Components
1. TEMA21 (Triple Exponential Moving Average)
Yellow Line - The most responsive trend indicator in the system
Significantly reduces lag compared to traditional moving averages
Formula: TEMA = 3×EMA1 - 3×EMA2 + EMA3
Provides early signals for potential trend changes
Ideal for timing entries and exits with minimal delay
2. SMA21 (Simple Moving Average)
Green Line - Always displayed in green regardless of trend direction
21-period simple moving average of closing prices
Represents the baseline trend reference
Acts as the primary support/resistance level in the system
3. EMA21 (Exponential Moving Average)
Dynamic Color Line - Changes color based on trend strength
Dark Green (#159015): Confirmed uptrend (bullish conditions)
Red (#f50000): Downtrend or weak trend (bearish/neutral conditions)
More responsive than SMA21 due to exponential weighting
Provides faster reaction to recent price movements
4. Dynamic Fill Band (SMA21/EMA21 Envelope)
Color-Coded Zone between SMA21 and EMA21
Light Green (#15e915, 19% transparency): Uptrend zone
Light Red (#f50000, 19% transparency): Downtrend zone
Visualizes the strength and volatility of the current trend
Width of the band indicates trend momentum and volatility
Trend Detection LogicThe indicator uses a dual-confirmation system for trend identification:
Price Position: Close must be above SMA21
Trend Slope: SMA21 must be rising (SMA21 > SMA21[1])
Both conditions must be met simultaneously for an uptrend confirmation.This conservative approach reduces false signals and ensures only h
オープンソーススクリプト
TradingViewの精神に則り、このスクリプトの作者はコードをオープンソースとして公開してくれました。トレーダーが内容を確認・検証できるようにという配慮です。作者に拍手を送りましょう!無料で利用できますが、コードの再公開はハウスルールに従う必要があります。
免責事項
この情報および投稿は、TradingViewが提供または推奨する金融、投資、トレード、その他のアドバイスや推奨を意図するものではなく、それらを構成するものでもありません。詳細は利用規約をご覧ください。
オープンソーススクリプト
TradingViewの精神に則り、このスクリプトの作者はコードをオープンソースとして公開してくれました。トレーダーが内容を確認・検証できるようにという配慮です。作者に拍手を送りましょう!無料で利用できますが、コードの再公開はハウスルールに従う必要があります。
免責事項
この情報および投稿は、TradingViewが提供または推奨する金融、投資、トレード、その他のアドバイスや推奨を意図するものではなく、それらを構成するものでもありません。詳細は利用規約をご覧ください。