INVITE-ONLY SCRIPT
更新済 Ultimate Buy&Sell Cycles
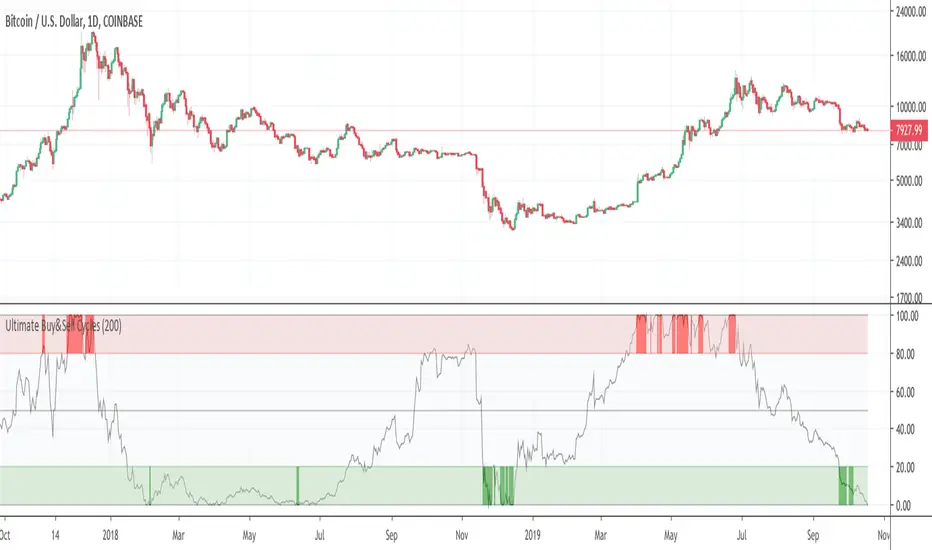
This indictor shows potential buy and sell zones of any asset.
リリースノート
Improvementsリリースノート
This Indicator helps to invest midterm / longterm. It shows possible levels for accumulation and selling.The accumulation phase is when the indicator is in the green (buy) zone. The opposite is the red (sell) zone.
Important:
This are not signals to buy or sell. This indicator should just help you by making your own decision.
This indicator works on nearly every asset (crypto, stocks, …). You shuld use it on a daily base.
リリースノート
Example Bitcoin Chart:Example Gold Chart:
リリースノート
Improvements.リリースノート
Corrections.リリースノート
.リリースノート
Corrections.招待専用スクリプト
こちらのスクリプトにアクセスできるのは投稿者が承認したユーザーだけです。投稿者にリクエストして使用許可を得る必要があります。通常の場合、支払い後に許可されます。詳細については、以下、作者の指示をお読みになるか、CryptoAndyに直接ご連絡ください。
スクリプトの機能を理解し、その作者を全面的に信頼しているのでなければ、お金を支払ってまでそのスクリプトを利用することをTradingViewとしては「非推奨」としています。コミュニティスクリプトの中で、その代わりとなる無料かつオープンソースのスクリプトを見つけられる可能性もあります。
作者の指示
❓❓ You want to use this Indicator? ❓❓
💲 Buy here: bit.ly/2OTpujA
💲 Buy here: bit.ly/2OTpujA
免責事項
これらの情報および投稿は、TradingViewが提供または保証する金融、投資、取引、またはその他の種類のアドバイスや推奨を意図したものではなく、またそのようなものでもありません。詳しくは利用規約をご覧ください。
招待専用スクリプト
こちらのスクリプトにアクセスできるのは投稿者が承認したユーザーだけです。投稿者にリクエストして使用許可を得る必要があります。通常の場合、支払い後に許可されます。詳細については、以下、作者の指示をお読みになるか、CryptoAndyに直接ご連絡ください。
スクリプトの機能を理解し、その作者を全面的に信頼しているのでなければ、お金を支払ってまでそのスクリプトを利用することをTradingViewとしては「非推奨」としています。コミュニティスクリプトの中で、その代わりとなる無料かつオープンソースのスクリプトを見つけられる可能性もあります。
作者の指示
❓❓ You want to use this Indicator? ❓❓
💲 Buy here: bit.ly/2OTpujA
💲 Buy here: bit.ly/2OTpujA
免責事項
これらの情報および投稿は、TradingViewが提供または保証する金融、投資、取引、またはその他の種類のアドバイスや推奨を意図したものではなく、またそのようなものでもありません。詳しくは利用規約をご覧ください。