OPEN-SOURCE SCRIPT
StDev Bands
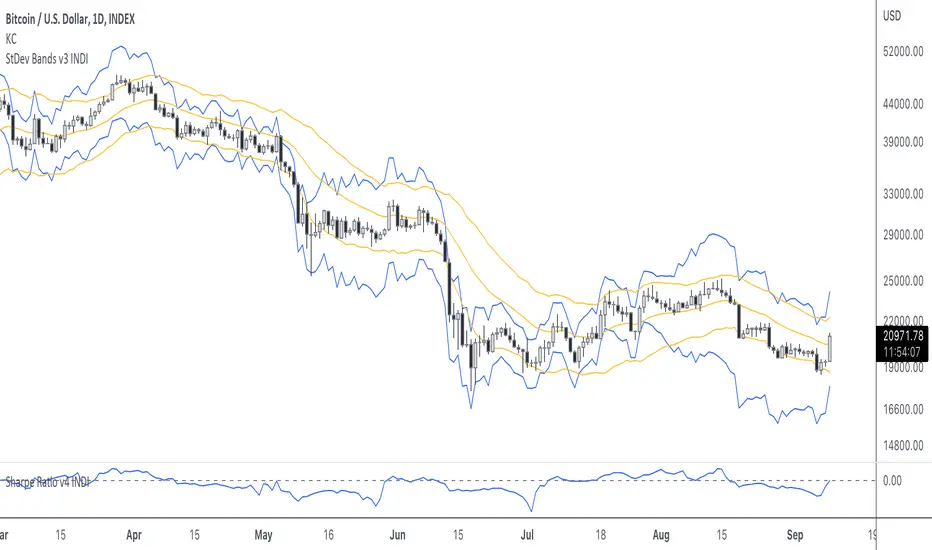
This is a "bands"-type indicator. It was developed out of my Sharpe Ratio indicator. It uses the standard deviation of returns as basis for drawing the bands. I'm going to update this indicator as the other indicator evolves. Please be sure you know how to calculate Sharpe Ratio and check out the Sharpe Ratio indicator as well. This will help you understand the purpose of this indicator a bit more.
As a very short introduction. Many investors use the standard deviation of returns as risk measurement. I admit the defaults of this indicator aren't perfect. Normally investors use the standard deviation over a 1 year period. Traditional finance uses 265 days, and because crypto never sleeps, we could use 365. I defaulted it to 20.
As a very short introduction. Many investors use the standard deviation of returns as risk measurement. I admit the defaults of this indicator aren't perfect. Normally investors use the standard deviation over a 1 year period. Traditional finance uses 265 days, and because crypto never sleeps, we could use 365. I defaulted it to 20.
オープンソーススクリプト
TradingViewの精神に則り、このスクリプトの作者はコードをオープンソースとして公開してくれました。トレーダーが内容を確認・検証できるようにという配慮です。作者に拍手を送りましょう!無料で利用できますが、コードの再公開はハウスルールに従う必要があります。
免責事項
この情報および投稿は、TradingViewが提供または推奨する金融、投資、トレード、その他のアドバイスや推奨を意図するものではなく、それらを構成するものでもありません。詳細は利用規約をご覧ください。
オープンソーススクリプト
TradingViewの精神に則り、このスクリプトの作者はコードをオープンソースとして公開してくれました。トレーダーが内容を確認・検証できるようにという配慮です。作者に拍手を送りましょう!無料で利用できますが、コードの再公開はハウスルールに従う必要があります。
免責事項
この情報および投稿は、TradingViewが提供または推奨する金融、投資、トレード、その他のアドバイスや推奨を意図するものではなく、それらを構成するものでもありません。詳細は利用規約をご覧ください。