OPEN-SOURCE SCRIPT
更新済 Arego ATR
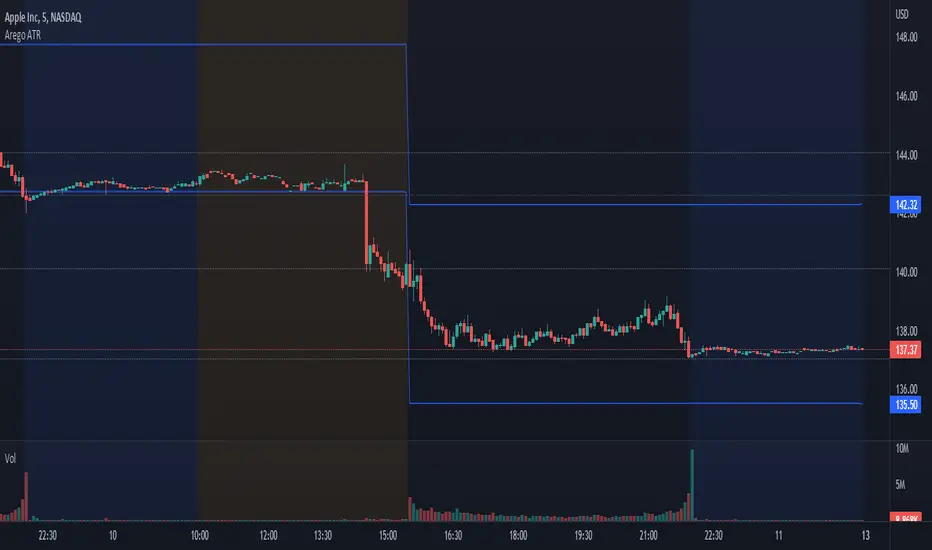
This script automatically calculates ATR on a daily basis where it would be highest and lowest and draws a line there.
With this you can see whether stock has passed the ATR or not.
When stock moves, line is adjusted as well. For example, the stock opened at $100 and moved down $1.
ATR is $5.
Script will then draw two lines on the chart.
Daily low ATR would then be $95 and daily high ATR would then be $104.
The formula is very simple:
Current price + ATR = daily high
Current price - ATR = daily low
リリースノート
I corrected my misconceptions in script logic.オープンソーススクリプト
TradingViewの精神に則り、このスクリプトの作者はコードをオープンソースとして公開してくれました。トレーダーが内容を確認・検証できるようにという配慮です。作者に拍手を送りましょう!無料で利用できますが、コードの再公開はハウスルールに従う必要があります。
免責事項
この情報および投稿は、TradingViewが提供または推奨する金融、投資、トレード、その他のアドバイスや推奨を意図するものではなく、それらを構成するものでもありません。詳細は利用規約をご覧ください。
オープンソーススクリプト
TradingViewの精神に則り、このスクリプトの作者はコードをオープンソースとして公開してくれました。トレーダーが内容を確認・検証できるようにという配慮です。作者に拍手を送りましょう!無料で利用できますが、コードの再公開はハウスルールに従う必要があります。
免責事項
この情報および投稿は、TradingViewが提供または推奨する金融、投資、トレード、その他のアドバイスや推奨を意図するものではなく、それらを構成するものでもありません。詳細は利用規約をご覧ください。