OPEN-SOURCE SCRIPT
Simple Risk-to-Reward (R) Indicator (TP1–TP2)

What this indicator does:
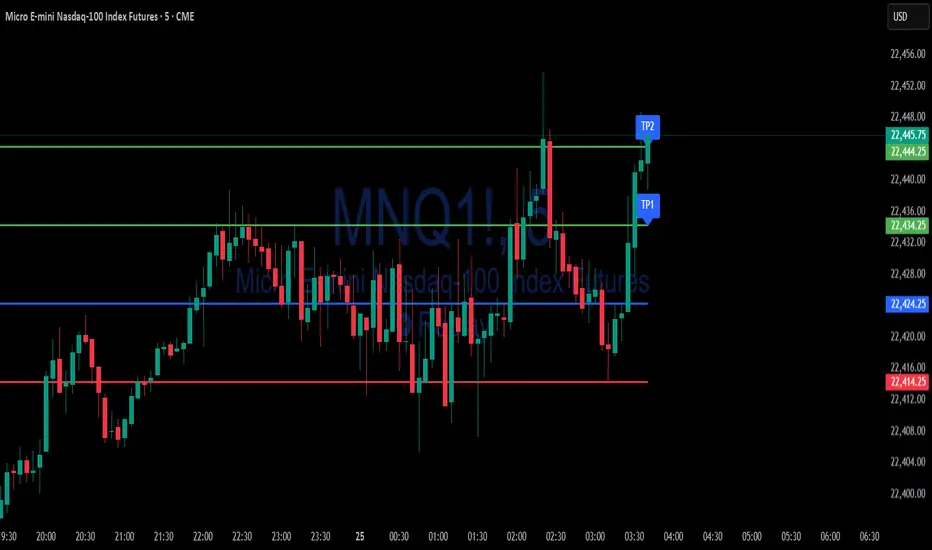
This tool helps traders clearly visualize their risk and reward on any trade by plotting their entry, stop loss, and take-profit (TP) levels directly on the chart. It’s designed to make manual trade planning more visual and systematic.
How it works:
How to use it:
What makes it unique and useful:
This indicator is designed for manual trade planning, giving you full control over your inputs and letting you instantly see your risk/reward on any instrument or timeframe. Unlike some built-in tools, it supports both long and short trades, lets you set all levels manually, and keeps your charts clean and easy to interpret.
This tool helps traders clearly visualize their risk and reward on any trade by plotting their entry, stop loss, and take-profit (TP) levels directly on the chart. It’s designed to make manual trade planning more visual and systematic.
How it works:
- You set your planned entry price, whether you want to plot a Long or Short setup, and your stop-loss distance (in ticks).
- The indicator calculates your stop-loss level and automatically plots it on the chart.
- It then draws take-profit levels at 1R and 2R (where “R” is your risk, the distance between entry and stop).
- You can toggle the TP1 and TP2 lines on or off to suit your preference.
How to use it:
- Open the settings and enter your intended entry price.
- Select “Long Setup” for a buy trade, or turn it off for a sell/short trade.
- Enter your desired stop loss in ticks.
- Choose which take-profit levels to display by toggling TP1 and TP2.
- The indicator will show entry, stop, and take-profit levels right on your chart so you can easily see your planned risk/reward.
What makes it unique and useful:
This indicator is designed for manual trade planning, giving you full control over your inputs and letting you instantly see your risk/reward on any instrument or timeframe. Unlike some built-in tools, it supports both long and short trades, lets you set all levels manually, and keeps your charts clean and easy to interpret.
オープンソーススクリプト
TradingViewの精神に則り、このスクリプトの作者はコードをオープンソースとして公開してくれました。トレーダーが内容を確認・検証できるようにという配慮です。作者に拍手を送りましょう!無料で利用できますが、コードの再公開はハウスルールに従う必要があります。
Simple Indicators – Premium tools & more: simpleindicators.gumroad.com/
免責事項
この情報および投稿は、TradingViewが提供または推奨する金融、投資、トレード、その他のアドバイスや推奨を意図するものではなく、それらを構成するものでもありません。詳細は利用規約をご覧ください。