OPEN-SOURCE SCRIPT
Fences
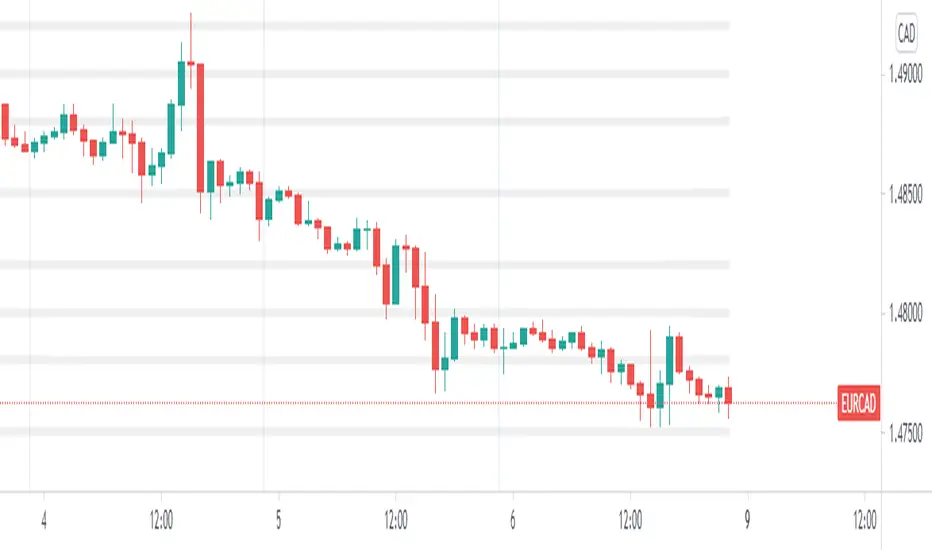
This is a simple script that plots horizontal grid on your chart using .x000 .x200 .x500 .x800 levels. Mike mentioned these levels in one of his videos.
Fences is only a semi-automatic indicator. You have to input the central point AND number of decimals yourself.
• Decimals are set to 3 but JPY pairs need it to be 1.
• Anchor point is the nearest level ending with three zeroes.
Fences is only a semi-automatic indicator. You have to input the central point AND number of decimals yourself.
• Decimals are set to 3 but JPY pairs need it to be 1.
• Anchor point is the nearest level ending with three zeroes.
リリースノート
A few visuals changed to look better on my charts.In addition, N1 N2 and N3 are now floats. So if you prefer 25 pip boxes as opposed to 200, 500, 800 levels, it is possible to set up now.
オープンソーススクリプト
TradingViewの精神に則り、このスクリプトの作者はコードをオープンソースとして公開してくれました。トレーダーが内容を確認・検証できるようにという配慮です。作者に拍手を送りましょう!無料で利用できますが、コードの再公開はハウスルールに従う必要があります。
免責事項
この情報および投稿は、TradingViewが提供または推奨する金融、投資、トレード、その他のアドバイスや推奨を意図するものではなく、それらを構成するものでもありません。詳細は利用規約をご覧ください。
オープンソーススクリプト
TradingViewの精神に則り、このスクリプトの作者はコードをオープンソースとして公開してくれました。トレーダーが内容を確認・検証できるようにという配慮です。作者に拍手を送りましょう!無料で利用できますが、コードの再公開はハウスルールに従う必要があります。
免責事項
この情報および投稿は、TradingViewが提供または推奨する金融、投資、トレード、その他のアドバイスや推奨を意図するものではなく、それらを構成するものでもありません。詳細は利用規約をご覧ください。