OPEN-SOURCE SCRIPT
Exponential-Decay Cumulative Spread (Cycle-Tuned)
## Indicator Overview
**Exponential-Decay Cumulative Spread (Cycle-Tuned)** – short title **LambdaCumDelta** – tracks the percentage spread between CEXs BTC spot prices.
By clipping outliers, applying an exponential-decay running sum, and comparing that sum to rolling percentile bands, the script flags potential **cycle bottoms** and **cycle tops** whenever the cumulative spread stays beyond extreme thresholds for three consecutive bars.
---
### Core Logic
1. **Price Spread**
`spread_pct = (cexA – cexB) / cexB × 100`.
2. **Outlier Suppression**
* Calculates the **90-day standard deviation σ** of `spread_pct`.
* Uses a **clip coefficient `k_clip`** (0.5–5.0) to cap the spread at `±k_clip × σ`, damping single-day anomalies.
3. **Exponential-Decay Sum**
* Applies a decay factor **λ** (0.50–0.999):
```
CumΔₜ = spread_clipₜ + λ × CumΔₜ₋₁
```
* Larger λ → longer memory half-life.
4. **Rolling Percentile Bands**
* Uses a **365-bar window** to derive dynamic percentile thresholds.
* Upper / Lower bands are set by **perc\_hi** and **perc\_lo** (e.g., 85 % and 15 %).
5. **Signal Definition**
* **Bullish** (cycle bottom): `CumΔ` above the upper band for **3 straight bars**.
* **Bearish** (cycle top): `CumΔ` below the lower band for **3 straight bars**.
---
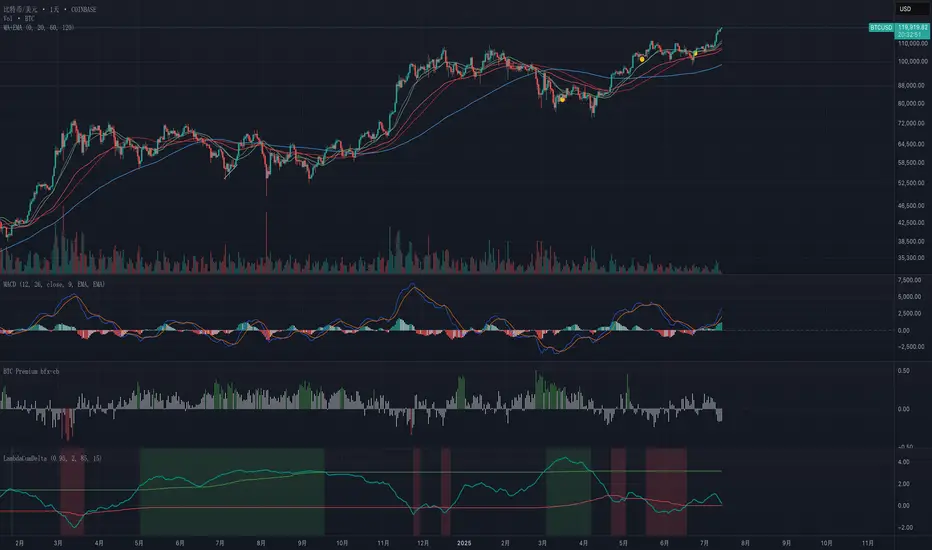
### Chart Elements
| Plot | Style | Meaning |
| --------------- | ----------------- | ----------------------------------- |
| **CumΔ** | Teal thick line | Exponential-decay cumulative spread |
| Upper Threshold | Green thin line | Rolling upper percentile |
| Lower Threshold | Red thin line | Rolling lower percentile |
| Background | Faded green / red | Bullish / bearish signal zone |
---
### Key Inputs
| Input | Default | Purpose |
| -------------------- | ------- | ------------------------------- |
| **Decay factor λ** | 0.95 | Memory length of CumΔ |
| **Clip coefficient** | 2.0 | Multiple of σ for outlier cap |
| **Upper percentile** | 85 | Cycle-bottom trigger percentile |
| **Lower percentile** | 15 | Cycle-top trigger percentile |
---
### Practical Tips
1. **Timing bias**
* Green background often precedes mean-reversion of the spread – consider scaling into longs or covering shorts.
* Red background suggests stretched positive spread – consider trimming longs or lightening exposure.
2. **Combine with volume, trend filters (MA, MACD, etc.)** to weed out false extremes.
3. Designed for **daily charts**; ensure both exchange feeds are synchronized.
---
### Alerts
Two built-in `alertcondition`s fire when bullish or bearish criteria are met, enabling push / email / webhook notifications.
---
### Disclaimer
This script is for educational and research purposes only and is **not** financial advice. Test thoroughly and trade at your own risk.
**Exponential-Decay Cumulative Spread (Cycle-Tuned)** – short title **LambdaCumDelta** – tracks the percentage spread between CEXs BTC spot prices.
By clipping outliers, applying an exponential-decay running sum, and comparing that sum to rolling percentile bands, the script flags potential **cycle bottoms** and **cycle tops** whenever the cumulative spread stays beyond extreme thresholds for three consecutive bars.
---
### Core Logic
1. **Price Spread**
`spread_pct = (cexA – cexB) / cexB × 100`.
2. **Outlier Suppression**
* Calculates the **90-day standard deviation σ** of `spread_pct`.
* Uses a **clip coefficient `k_clip`** (0.5–5.0) to cap the spread at `±k_clip × σ`, damping single-day anomalies.
3. **Exponential-Decay Sum**
* Applies a decay factor **λ** (0.50–0.999):
```
CumΔₜ = spread_clipₜ + λ × CumΔₜ₋₁
```
* Larger λ → longer memory half-life.
4. **Rolling Percentile Bands**
* Uses a **365-bar window** to derive dynamic percentile thresholds.
* Upper / Lower bands are set by **perc\_hi** and **perc\_lo** (e.g., 85 % and 15 %).
5. **Signal Definition**
* **Bullish** (cycle bottom): `CumΔ` above the upper band for **3 straight bars**.
* **Bearish** (cycle top): `CumΔ` below the lower band for **3 straight bars**.
---
### Chart Elements
| Plot | Style | Meaning |
| --------------- | ----------------- | ----------------------------------- |
| **CumΔ** | Teal thick line | Exponential-decay cumulative spread |
| Upper Threshold | Green thin line | Rolling upper percentile |
| Lower Threshold | Red thin line | Rolling lower percentile |
| Background | Faded green / red | Bullish / bearish signal zone |
---
### Key Inputs
| Input | Default | Purpose |
| -------------------- | ------- | ------------------------------- |
| **Decay factor λ** | 0.95 | Memory length of CumΔ |
| **Clip coefficient** | 2.0 | Multiple of σ for outlier cap |
| **Upper percentile** | 85 | Cycle-bottom trigger percentile |
| **Lower percentile** | 15 | Cycle-top trigger percentile |
---
### Practical Tips
1. **Timing bias**
* Green background often precedes mean-reversion of the spread – consider scaling into longs or covering shorts.
* Red background suggests stretched positive spread – consider trimming longs or lightening exposure.
2. **Combine with volume, trend filters (MA, MACD, etc.)** to weed out false extremes.
3. Designed for **daily charts**; ensure both exchange feeds are synchronized.
---
### Alerts
Two built-in `alertcondition`s fire when bullish or bearish criteria are met, enabling push / email / webhook notifications.
---
### Disclaimer
This script is for educational and research purposes only and is **not** financial advice. Test thoroughly and trade at your own risk.
オープンソーススクリプト
TradingViewの精神に則り、このスクリプトの作者はコードをオープンソースとして公開してくれました。トレーダーが内容を確認・検証できるようにという配慮です。作者に拍手を送りましょう!無料で利用できますが、コードの再公開はハウスルールに従う必要があります。
免責事項
この情報および投稿は、TradingViewが提供または推奨する金融、投資、トレード、その他のアドバイスや推奨を意図するものではなく、それらを構成するものでもありません。詳細は利用規約をご覧ください。
オープンソーススクリプト
TradingViewの精神に則り、このスクリプトの作者はコードをオープンソースとして公開してくれました。トレーダーが内容を確認・検証できるようにという配慮です。作者に拍手を送りましょう!無料で利用できますが、コードの再公開はハウスルールに従う必要があります。
免責事項
この情報および投稿は、TradingViewが提供または推奨する金融、投資、トレード、その他のアドバイスや推奨を意図するものではなく、それらを構成するものでもありません。詳細は利用規約をご覧ください。