OPEN-SOURCE SCRIPT
更新済 [Becak] - Swing Point Retracement & Prediction
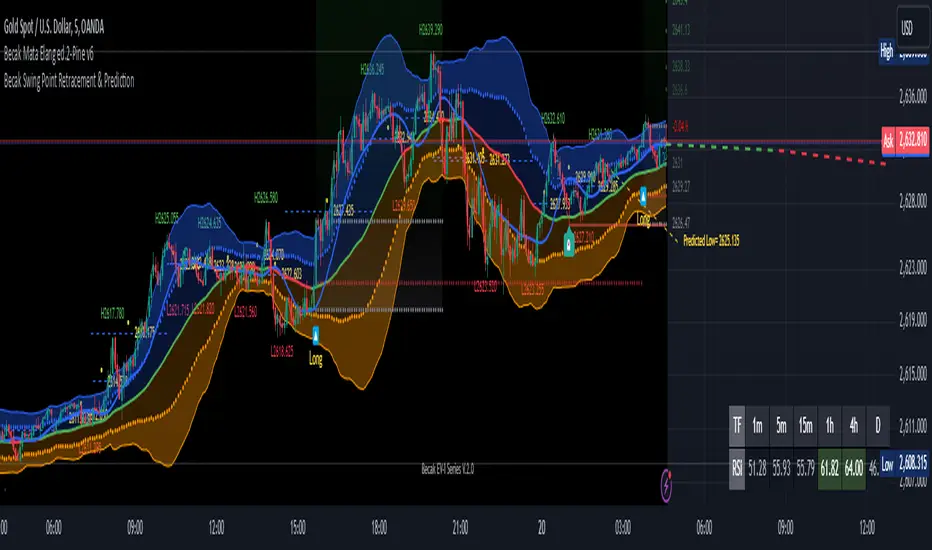
"[Becak] - Swing Point Retracement & Prediction," is designed to identify swing points in price action, calculate retracement levels, and predict potential future price levels. It's a technical analysis tool that can help traders identify potential support and resistance levels, as well as possible reversal points.
HOW IT WORK
Swing Point Detection:
The indicator uses the ta.pivothigh() and ta.pivotlow() functions to identify swing highs and lows within a specified lookback period.
Retracement Levels:
When a new swing point is detected, the indicator calculates a retracement level based on the user-defined retracement percentage. It draws a dashed blue line at the retracement level, along with a yellow circle and a label showing the price.
Swing Point Labeling:
Swing highs are marked with a green "H" label and the price, and Swing lows are marked with a red "L" label and the price.
Price Prediction:
Based on the most recent swing point, the indicator attempts to predict the next potential high or low. It draws a purple dashed line extending into the future, indicating the predicted price level.
HOW TO USE THIS INDICATOR:
adjust the input parameters:
"Swing Point Lookback": Determines how far back the indicator looks to identify swing points. A larger value will result in fewer, more significant swing points.
"Retracement %": Sets the percentage for calculating retracement levels. 50% is a common Fibonacci retracement level, but you can adjust this based on your trading strategy.
"Prediction Length": Determines how far into the future the prediction line extends.
Interpret the results:
Use the swing point labels (H and L) to quickly identify recent highs and lows. The blue dashed lines and yellow circles indicate potential support or resistance levels based on the retracement percentage.The purple dashed line shows a potential future price target. This can be used to set profit targets or identify potential reversal zones.
Combine with other analysis:
This indicator works best when combined with other forms of analysis, such as trend lines, moving averages, or candlestick patterns.
Use the retracement levels and predictions as potential entry or exit points, but always confirm with other indicators or price action signals.
リリースノート
change the color of prediction low and prediction highリリースノート
update to pinescript v6オープンソーススクリプト
TradingViewの精神に則り、このスクリプトの作者はコードをオープンソースとして公開してくれました。トレーダーが内容を確認・検証できるようにという配慮です。作者に拍手を送りましょう!無料で利用できますが、コードの再公開はハウスルールに従う必要があります。
免責事項
この情報および投稿は、TradingViewが提供または推奨する金融、投資、トレード、その他のアドバイスや推奨を意図するものではなく、それらを構成するものでもありません。詳細は利用規約をご覧ください。
オープンソーススクリプト
TradingViewの精神に則り、このスクリプトの作者はコードをオープンソースとして公開してくれました。トレーダーが内容を確認・検証できるようにという配慮です。作者に拍手を送りましょう!無料で利用できますが、コードの再公開はハウスルールに従う必要があります。
免責事項
この情報および投稿は、TradingViewが提供または推奨する金融、投資、トレード、その他のアドバイスや推奨を意図するものではなく、それらを構成するものでもありません。詳細は利用規約をご覧ください。