OPEN-SOURCE SCRIPT
RTH Session Range Position (0-100) with EMA

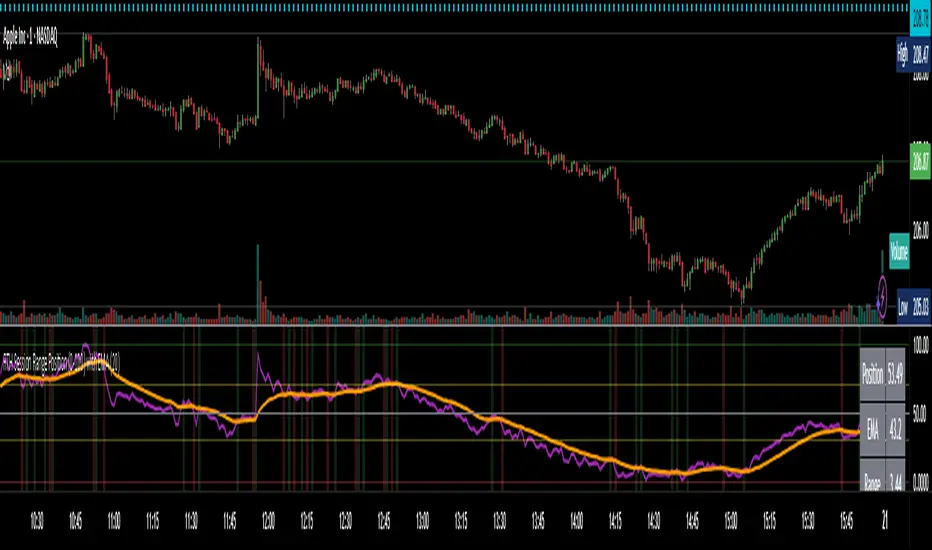
A Pine Script indicator designed to help traders understand where the current price is located within the Regular Trading Hours (RTH) session range, from 0 (session low) to 100 (session high). It also plots a smoothed EMA of this position to provide insight into momentum or trend during the RTH session.
What the Indicator Does
Defines RTH (Regular Trading Hours):
Tracks the session's high and low during RTH:
Calculates position of the current price within the RTH range:
Calculates an EMA of that position (posEMA):
Plots and table:
Visual cues:
Alerts:
How to Use It Effectively
1. Session Strength & Momentum
2. Breakout or Reversal Detection
3. Range Context for Entries
If you're a mean-reversion trader, look for:
Price > 70 + turning down below EMA → possible short.
Price < 30 + turning up above EMA → possible long.
For breakout traders, you might wait for:
Crosses above 70 with EMA support.
Crosses below 30 with EMA resistance.
4. Confirmation Tool
Use this indicator alongside others to confirm:
What the Indicator Does
Defines RTH (Regular Trading Hours):
- Start: 9:30 AM
- End: 4:00 PM
- These are typical US equity market hours.
Tracks the session's high and low during RTH:
- sessionHigh and sessionLow update only during RTH.
Calculates position of the current price within the RTH range:
- Formula: ((close - sessionLow) / (sessionHigh - sessionLow)) * 100
- Result is a percentage:
- 0 = at session low
- 100 = at session high
- 50 = middle of session range
Calculates an EMA of that position (posEMA):
- Smooths out the raw position to help visualize momentum within the range.
Plots and table:
- Plots pos and posEMA on a separate chart pane.
- Adds horizontal lines at key levels (0, 30, 50, 70, 100).
- Table shows current values for Position, EMA, and Range.
Visual cues:
- bgcolor highlights when pos crosses over or under the EMA — potential momentum shifts.
Alerts:
- Cross above/below 50 (session midpoint).
- Cross above/below EMA.
How to Use It Effectively
1. Session Strength & Momentum
- Position above 70: Price is near session highs — strong upward momentum.
- Position below 30: Price is near session lows — strong downward momentum.
- Use the EMA of position to filter out noise and identify trends.
2. Breakout or Reversal Detection
- Cross above EMA: Momentum may be turning bullish.
- Cross below EMA: Momentum may be turning bearish.
- These crosses (especially near mid-levels like 50) can hint at session trend shifts.
3. Range Context for Entries
If you're a mean-reversion trader, look for:
Price > 70 + turning down below EMA → possible short.
Price < 30 + turning up above EMA → possible long.
For breakout traders, you might wait for:
Crosses above 70 with EMA support.
Crosses below 30 with EMA resistance.
4. Confirmation Tool
Use this indicator alongside others to confirm:
- Whether price action has strength within the day.
- Whether breakouts have real momentum or are extended already.
オープンソーススクリプト
TradingViewの精神に則り、このスクリプトの作者はコードをオープンソースとして公開してくれました。トレーダーが内容を確認・検証できるようにという配慮です。作者に拍手を送りましょう!無料で利用できますが、コードの再公開はハウスルールに従う必要があります。
免責事項
この情報および投稿は、TradingViewが提供または推奨する金融、投資、トレード、その他のアドバイスや推奨を意図するものではなく、それらを構成するものでもありません。詳細は利用規約をご覧ください。
オープンソーススクリプト
TradingViewの精神に則り、このスクリプトの作者はコードをオープンソースとして公開してくれました。トレーダーが内容を確認・検証できるようにという配慮です。作者に拍手を送りましょう!無料で利用できますが、コードの再公開はハウスルールに従う必要があります。
免責事項
この情報および投稿は、TradingViewが提供または推奨する金融、投資、トレード、その他のアドバイスや推奨を意図するものではなく、それらを構成するものでもありません。詳細は利用規約をご覧ください。