OPEN-SOURCE SCRIPT
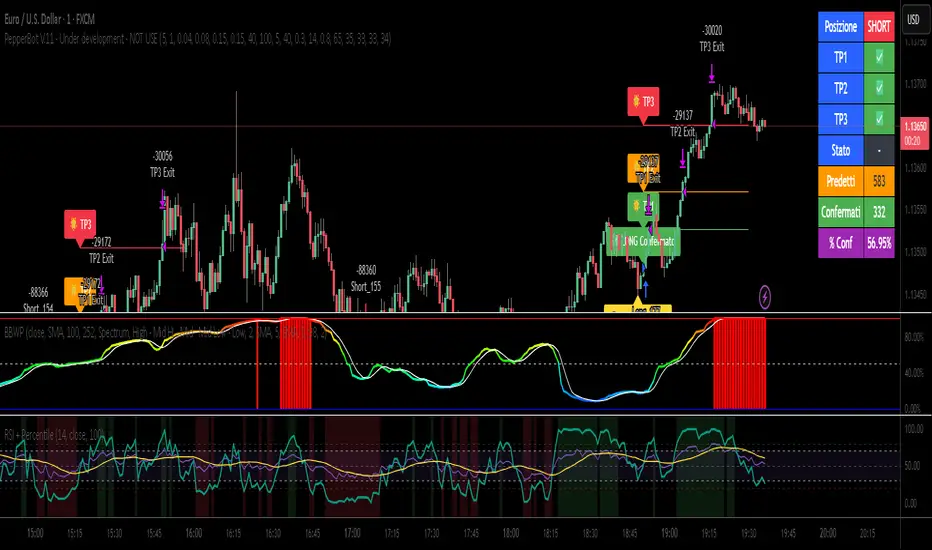
Relative Strength Index with Percentile

📈 Relative Strength Index with Percentile Rank (RSI + Percentile)
This advanced RSI indicator adds a powerful percentile ranking system to the classic Relative Strength Index, providing deeper insight into current RSI values relative to recent history.
🔍 Key Features:
Standard RSI Calculation: Identifies overbought/oversold levels using a customizable period.
RSI Percentile (0–100%): Calculates where the current RSI value stands within a user-defined lookback period.
Dynamic Background Coloring:
🟩 Green when RSI percentile is above 80% (strong relative strength)
🟥 Red when RSI percentile is below 20% (strong relative weakness)
Optional Divergence Detection: Spot classic bullish and bearish divergences between price and RSI.
Smoothing Options: Apply various moving averages (SMA, EMA, RMA, etc.) to the RSI, with optional Bollinger Bands.
Flexible Settings: Full control over lookback periods, smoothing type, and band sensitivity.
🧠 Why Use RSI Percentile?
Traditional RSI values can become less informative during trending markets. By ranking the RSI as a percentile, you gain contextual insight into whether the current strength is unusually high or low compared to recent history, rather than just a fixed 70/30 threshold.
オープンソーススクリプト
TradingViewの精神に則り、このスクリプトの作者はコードをオープンソースとして公開してくれました。トレーダーが内容を確認・検証できるようにという配慮です。作者に拍手を送りましょう!無料で利用できますが、コードの再公開はハウスルールに従う必要があります。
免責事項
この情報および投稿は、TradingViewが提供または推奨する金融、投資、トレード、その他のアドバイスや推奨を意図するものではなく、それらを構成するものでもありません。詳細は利用規約をご覧ください。
オープンソーススクリプト
TradingViewの精神に則り、このスクリプトの作者はコードをオープンソースとして公開してくれました。トレーダーが内容を確認・検証できるようにという配慮です。作者に拍手を送りましょう!無料で利用できますが、コードの再公開はハウスルールに従う必要があります。
免責事項
この情報および投稿は、TradingViewが提供または推奨する金融、投資、トレード、その他のアドバイスや推奨を意図するものではなく、それらを構成するものでもありません。詳細は利用規約をご覧ください。