OPEN-SOURCE SCRIPT
Total Return (divi reivested)
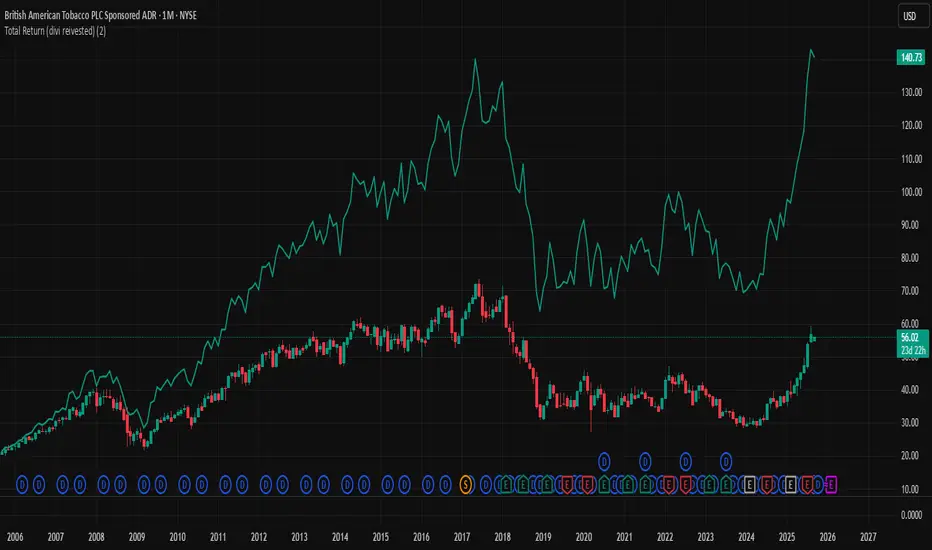
Total Return (Dividends Reinvested) — Price Scale
This indicator overlays a Total Return price line on the chart. It shows how the stock would have performed if all dividends had been reinvested back into the stock (buying fractional shares) rather than taken as cash.
The line starts exactly at the price level of the first visible bar on your chart and moves in the same price units as the chart (not indexed to 100).
Until the first dividend inside the visible window, the Total Return line is identical to the price. From the first dividend onward, it gradually diverges upwards, reflecting the effect of reinvested payouts.
Settings:
Reinvest at Open / Close — Choose whether reinvestment uses the bar’s open or close price.
Apply effect on the next bar — If enabled, reinvestment shows up from the bar after the dividend date (common in practice).
Show dividend markers — Optionally plots labels where dividend events occur.
Line width — Adjusts the thickness of the plotted Total Return line.
Use case:
This tool is useful if you want to compare plain price performance with true shareholder returns including dividends. It helps evaluate dividend stocks (like BTI, T, XOM, etc.) more realistically.
オープンソーススクリプト
TradingViewの精神に則り、このスクリプトの作者はコードをオープンソースとして公開してくれました。トレーダーが内容を確認・検証できるようにという配慮です。作者に拍手を送りましょう!無料で利用できますが、コードの再公開はハウスルールに従う必要があります。
免責事項
この情報および投稿は、TradingViewが提供または推奨する金融、投資、トレード、その他のアドバイスや推奨を意図するものではなく、それらを構成するものでもありません。詳細は利用規約をご覧ください。
オープンソーススクリプト
TradingViewの精神に則り、このスクリプトの作者はコードをオープンソースとして公開してくれました。トレーダーが内容を確認・検証できるようにという配慮です。作者に拍手を送りましょう!無料で利用できますが、コードの再公開はハウスルールに従う必要があります。
免責事項
この情報および投稿は、TradingViewが提供または推奨する金融、投資、トレード、その他のアドバイスや推奨を意図するものではなく、それらを構成するものでもありません。詳細は利用規約をご覧ください。