OPEN-SOURCE SCRIPT
更新済 Previous Day High, Low + Today's Opening Price [DB]
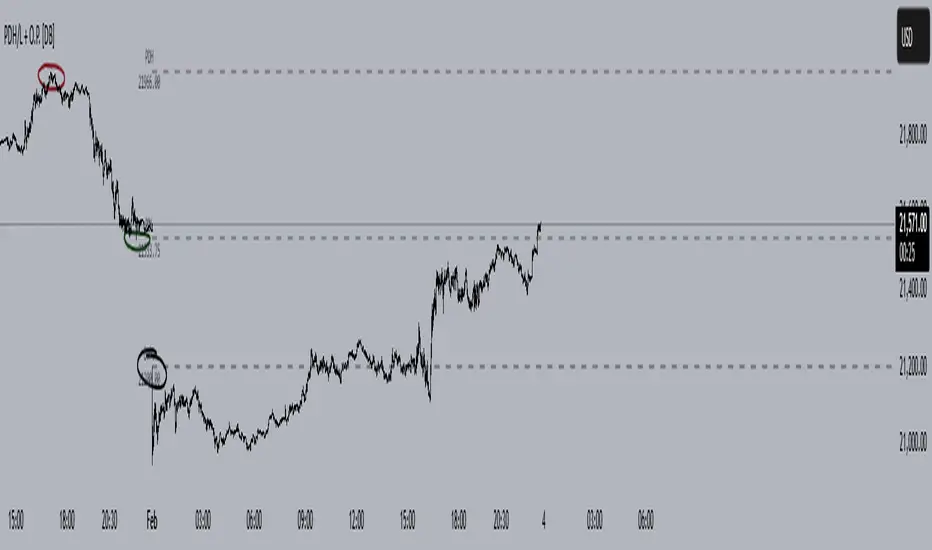
This indicator plots horizontal reference lines showing three price levels:
Settings & Customization
Labels:
The goal of this indicator is to simplify tracking potentionally important daily levels without manual drawing.
Works on all timeframes (from 1-minute to weekly charts). The levels auto-update daily at market open and they are non-repainting (historical levels stay fixed).
- Previous Day's High (PDH) – Dark red line by default
- Previous Day's Low (PDL) – Dark green line by default
- Today's Opening Price (O.P.) – Black line by default
Settings & Customization
- Adjust line colors, width (default: 2px), and transparency (30% by default).
- Choose line styles: Solid, Dashed, or Dotted.
Labels:
- Toggle labels (PDH/PDL/O.P.) on/off.
- Optional price values below labels.
The goal of this indicator is to simplify tracking potentionally important daily levels without manual drawing.
Works on all timeframes (from 1-minute to weekly charts). The levels auto-update daily at market open and they are non-repainting (historical levels stay fixed).
リリースノート
Fixed a bug where adding the indicator to the chart created a new price scale.オープンソーススクリプト
TradingViewの精神に則り、このスクリプトの作者はコードをオープンソースとして公開してくれました。トレーダーが内容を確認・検証できるようにという配慮です。作者に拍手を送りましょう!無料で利用できますが、コードの再公開はハウスルールに従う必要があります。
免責事項
この情報および投稿は、TradingViewが提供または推奨する金融、投資、トレード、その他のアドバイスや推奨を意図するものではなく、それらを構成するものでもありません。詳細は利用規約をご覧ください。
オープンソーススクリプト
TradingViewの精神に則り、このスクリプトの作者はコードをオープンソースとして公開してくれました。トレーダーが内容を確認・検証できるようにという配慮です。作者に拍手を送りましょう!無料で利用できますが、コードの再公開はハウスルールに従う必要があります。
免責事項
この情報および投稿は、TradingViewが提供または推奨する金融、投資、トレード、その他のアドバイスや推奨を意図するものではなく、それらを構成するものでもありません。詳細は利用規約をご覧ください。