OPEN-SOURCE SCRIPT
更新済 Indices Tracker and VOLD-Market Breadth
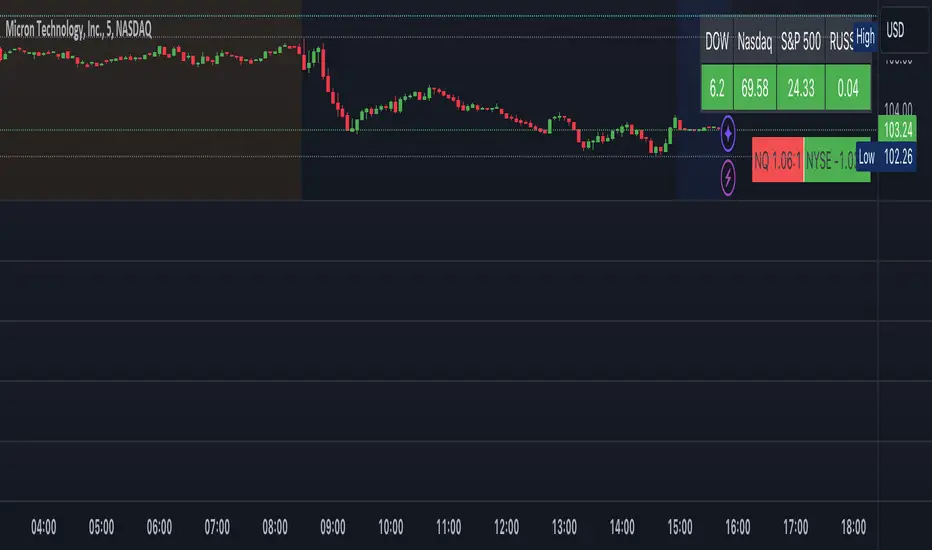
This is an overlay displaying DOW, Nasdaq and S&P performance for the day in real-time along with NQ and NYSE market breadth display.
Overview of the Script:
The Dow, Nasdaq, S&P Tracker section is at the top, displaying the current index values, changes, and colors.
The VOLD-Market Breadth section is below, providing the market breadth information.
Helpful to get a market view while trading stocks or options directionally.
Overview of the Script:
The Dow, Nasdaq, S&P Tracker section is at the top, displaying the current index values, changes, and colors.
The VOLD-Market Breadth section is below, providing the market breadth information.
Helpful to get a market view while trading stocks or options directionally.
リリースノート
Basic script overlaying US market indices (Dow, Nasdaq, S&P and Russel) on the chart along with market breadth information of NQ and NYSE.Ready reference while exploring other stocks for trading.
オープンソーススクリプト
TradingViewの精神に則り、このスクリプトの作者はコードをオープンソースとして公開してくれました。トレーダーが内容を確認・検証できるようにという配慮です。作者に拍手を送りましょう!無料で利用できますが、コードの再公開はハウスルールに従う必要があります。
免責事項
この情報および投稿は、TradingViewが提供または推奨する金融、投資、トレード、その他のアドバイスや推奨を意図するものではなく、それらを構成するものでもありません。詳細は利用規約をご覧ください。
オープンソーススクリプト
TradingViewの精神に則り、このスクリプトの作者はコードをオープンソースとして公開してくれました。トレーダーが内容を確認・検証できるようにという配慮です。作者に拍手を送りましょう!無料で利用できますが、コードの再公開はハウスルールに従う必要があります。
免責事項
この情報および投稿は、TradingViewが提供または推奨する金融、投資、トレード、その他のアドバイスや推奨を意図するものではなく、それらを構成するものでもありません。詳細は利用規約をご覧ください。