INVITE-ONLY SCRIPT
更新済 LFOM Index
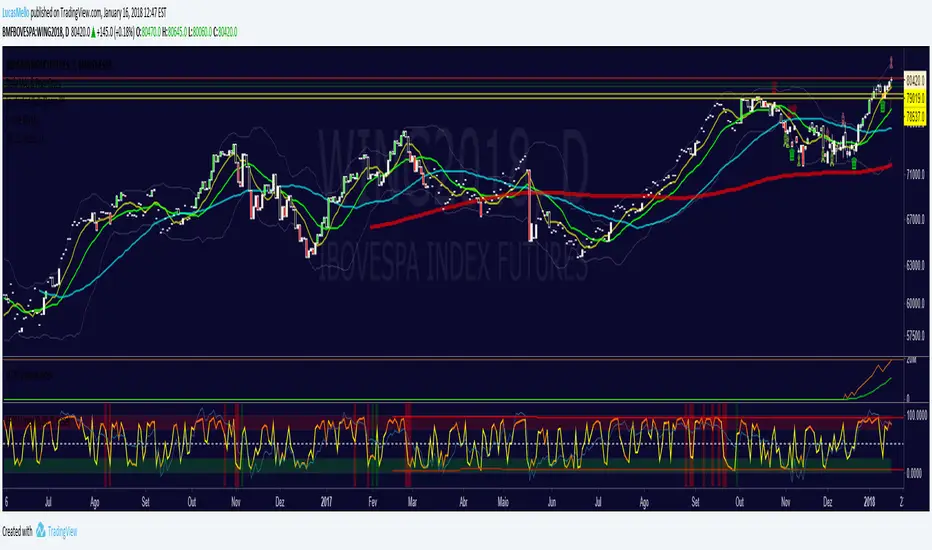
The ultimate Momentum Oscillator!
The ticker line act as a common momentum oscillator. When it's orange, the trustability of the overbought/oversold condition is greater.
The thiner line is made to be used on range moments, such as squares or envelopes.
The background collors indicates good moments to buy (green) or sell (red) - the signal is triggered in the very moment that the background color appears.
How to use:
!!!!! DON'T SELL ON STRONG BULL TRENDS AND DON'T BUY ON STRONG BEAR TRENDS!!
When facing a extremely strong bull market, overbought areas must be used as signs to take profits, not points to enter conter positions. The same rule applies to strong bear markets, in which the oversold areas indicates good points to cover position.
リリースノート
Now you can see when on of the strategies is about to be triggeredリリースノート
Add Fatigue lvlリリースノート
improveリリースノート
fixリリースノート
Improved招待専用スクリプト
このスクリプトは作者が承認したユーザーのみアクセス可能です。使用するにはアクセス申請をして許可を得る必要があります。通常は支払い後に承認されます。詳細は下記の作者の指示に従うか、LucasMelloに直接お問い合わせください。
TradingViewは、作者を完全に信頼し、スクリプトの動作を理解していない限り、有料スクリプトの購入・使用を推奨しません。コミュニティスクリプトには無料のオープンソースの代替が多数あります。
作者の指示
免責事項
この情報および投稿は、TradingViewが提供または推奨する金融、投資、トレード、その他のアドバイスや推奨を意図するものではなく、それらを構成するものでもありません。詳細は利用規約をご覧ください。
招待専用スクリプト
このスクリプトは作者が承認したユーザーのみアクセス可能です。使用するにはアクセス申請をして許可を得る必要があります。通常は支払い後に承認されます。詳細は下記の作者の指示に従うか、LucasMelloに直接お問い合わせください。
TradingViewは、作者を完全に信頼し、スクリプトの動作を理解していない限り、有料スクリプトの購入・使用を推奨しません。コミュニティスクリプトには無料のオープンソースの代替が多数あります。
作者の指示
免責事項
この情報および投稿は、TradingViewが提供または推奨する金融、投資、トレード、その他のアドバイスや推奨を意図するものではなく、それらを構成するものでもありません。詳細は利用規約をご覧ください。