OPEN-SOURCE SCRIPT
Previous RTH Levels (RTH Only)
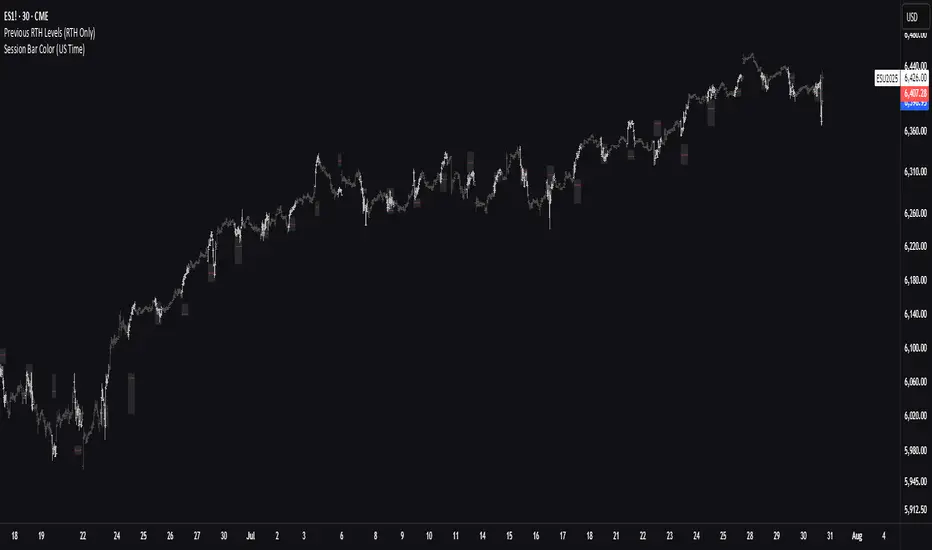
Previous RTH Levels on current session (RTH Only)
This indicator calculates key volume profile levels from the previous Regular Trading Hours (RTH) session and projects them onto the current RTH session. It is designed to provide traders with significant historical price levels—Point of Control (POC), Value Area High (VAH), and Value Area Low (VAL)—to use as potential support, resistance, and pivot points for intraday trading.
Instead of just plotting lines, this script highlights the entire Value Area (VA) between the VAH and VAL, offering a clear visual reference for the prior day's zone of price agreement.
オープンソーススクリプト
TradingViewの精神に則り、このスクリプトの作者はコードをオープンソースとして公開してくれました。トレーダーが内容を確認・検証できるようにという配慮です。作者に拍手を送りましょう!無料で利用できますが、コードの再公開はハウスルールに従う必要があります。
免責事項
この情報および投稿は、TradingViewが提供または推奨する金融、投資、トレード、その他のアドバイスや推奨を意図するものではなく、それらを構成するものでもありません。詳細は利用規約をご覧ください。
オープンソーススクリプト
TradingViewの精神に則り、このスクリプトの作者はコードをオープンソースとして公開してくれました。トレーダーが内容を確認・検証できるようにという配慮です。作者に拍手を送りましょう!無料で利用できますが、コードの再公開はハウスルールに従う必要があります。
免責事項
この情報および投稿は、TradingViewが提供または推奨する金融、投資、トレード、その他のアドバイスや推奨を意図するものではなく、それらを構成するものでもありません。詳細は利用規約をご覧ください。