OPEN-SOURCE SCRIPT
QuantNomad - Bitcoin NVT/NVTS
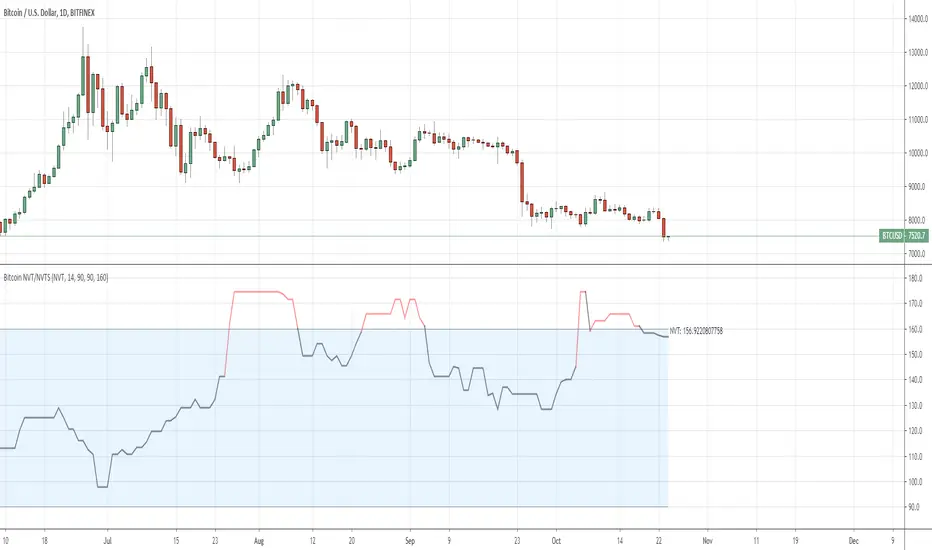
In this script I included 2 quite interesting indicators for Bitcoin:
* NVT (Network Value to Transactions Ratio)
* NVTS (NVT Signal)
Both indicators are based on Bitcoin Network Value (Market Cap) and 24h transaction volume.
For both these values I'm using Quandl datasets from Blockchainc.com:
market_cap: QUANDL:BCHAIN/MKTCP
transac_vol: QUANDL:BCHAIN/ETRVU
Calculation for both indicators are pretty simple:
NVT = median(market_cap / transac_vol, 14 bars)
NVTS = market_cap / sma(transac_vol, 90 bars)
NVT and NVTS are cryptocurrency's answers to P/E ratio. They can help you to understand if bitcoin is under/overvalued.
When NVT or NVTS is relatively high it can be a pretty good point to short bitcoin, if it's low it good time to buy bitcoin.
NVT Ratio - was created by Willy Woo
NVT Signal - was created by Dimitry Kalichkin
Because of different sources of transaction volume data, these indicators can differ in values from originals, but magnitude should be the same.
This is a pretty simple example where you can select only static overbought/oversold levels and when indicator will be above/below it you will see in changing in color.
I have many more things in my head how these indicators can be developed further and what strategies can be derived from them, but as is they can be a pretty good base for you. Will share my advanced findings later.
オープンソーススクリプト
TradingViewの精神に則り、このスクリプトの作者はコードをオープンソースとして公開してくれました。トレーダーが内容を確認・検証できるようにという配慮です。作者に拍手を送りましょう!無料で利用できますが、コードの再公開はハウスルールに従う必要があります。
💻 Online Courses and Access to PRO Indicators in the QuanTribe community: qntly.com/qt
💼 Hire Us: qntly.com/pine
📞 Book a call: qntly.com/cons
📰 qntly.com/news
𝕏: qntly.com/x
📩 qntly.com/tel
💼 Hire Us: qntly.com/pine
📞 Book a call: qntly.com/cons
📰 qntly.com/news
𝕏: qntly.com/x
📩 qntly.com/tel
免責事項
この情報および投稿は、TradingViewが提供または推奨する金融、投資、トレード、その他のアドバイスや推奨を意図するものではなく、それらを構成するものでもありません。詳細は利用規約をご覧ください。