OPEN-SOURCE SCRIPT
更新済 3 Day Lookback [TFO]
This 3 Day Lookback indicator aims to display key information about price with respect to its previous 3 day highs and lows. It was built with the intention of being compact in order to not take up a lot of chart space.
The core component of this indicator is the table. From this table, we look at price with respect to the ranges from 1, 2, and 3 days ago, and assign it a color code. By default, we use 🟢, 🟡, and 🔴 to indicate that price is above, stuck inside, or below these ranges, respectively.
Take the following chart as an example. We manually drew these boxes to encompass the range of each day, from high to low. The leftmost box from 3 days ago is colored red to reflect the fact that price is below that day's low. This is why the table indicates a state of 🔴 for the range from 3 days ago. Then, the following two days are colored yellow to indicate that price is currently trading inside their ranges, which is why the state for both of those days is indicated as 🟡 in the table.

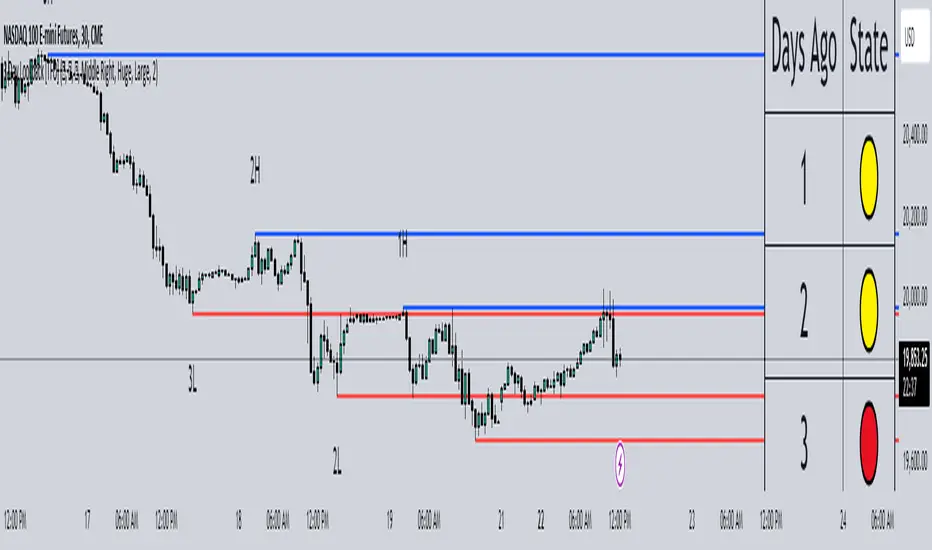
In a similar example below, we can see that price is clearly above the high from 3 days ago and the high from 2 days ago, which is reflected in the table with a state of 🟢 for both. However, since price is currently trading within the range from 1 day ago, it is assigned a state of 🟡 in the table.

As you may have noticed in the above examples, each day's high and low is indicated with labels (ex. "2H" and "2L" for the high and low from 2 days ago). These are optional and can be turned off in the indicator's settings. The lines tracking the previous 3 day highs and lows may also be turned off so that you're just left with the table, as is shown in the below example.

With this minimalistic table, users can get a quick glance at how price is trading with respect to the last few days of price action. Hopefully this proves useful for mobile users as well, since the indicator can be reduced to a simple table that doesn't take up much chart space.
The core component of this indicator is the table. From this table, we look at price with respect to the ranges from 1, 2, and 3 days ago, and assign it a color code. By default, we use 🟢, 🟡, and 🔴 to indicate that price is above, stuck inside, or below these ranges, respectively.
Take the following chart as an example. We manually drew these boxes to encompass the range of each day, from high to low. The leftmost box from 3 days ago is colored red to reflect the fact that price is below that day's low. This is why the table indicates a state of 🔴 for the range from 3 days ago. Then, the following two days are colored yellow to indicate that price is currently trading inside their ranges, which is why the state for both of those days is indicated as 🟡 in the table.
In a similar example below, we can see that price is clearly above the high from 3 days ago and the high from 2 days ago, which is reflected in the table with a state of 🟢 for both. However, since price is currently trading within the range from 1 day ago, it is assigned a state of 🟡 in the table.
As you may have noticed in the above examples, each day's high and low is indicated with labels (ex. "2H" and "2L" for the high and low from 2 days ago). These are optional and can be turned off in the indicator's settings. The lines tracking the previous 3 day highs and lows may also be turned off so that you're just left with the table, as is shown in the below example.
With this minimalistic table, users can get a quick glance at how price is trading with respect to the last few days of price action. Hopefully this proves useful for mobile users as well, since the indicator can be reduced to a simple table that doesn't take up much chart space.
リリースノート
- Changed the label notation, for example "H2" is now "2H"- Added an option to display labels on the right
- Added label tooltips to display their prices
- Removed the infinite extension of levels to the right-hand side of the chart (anchored to the current bar instead)
オープンソーススクリプト
TradingViewの精神に則り、このスクリプトの作者はコードをオープンソースとして公開してくれました。トレーダーが内容を確認・検証できるようにという配慮です。作者に拍手を送りましょう!無料で利用できますが、コードの再公開はハウスルールに従う必要があります。
免責事項
この情報および投稿は、TradingViewが提供または推奨する金融、投資、トレード、その他のアドバイスや推奨を意図するものではなく、それらを構成するものでもありません。詳細は利用規約をご覧ください。
オープンソーススクリプト
TradingViewの精神に則り、このスクリプトの作者はコードをオープンソースとして公開してくれました。トレーダーが内容を確認・検証できるようにという配慮です。作者に拍手を送りましょう!無料で利用できますが、コードの再公開はハウスルールに従う必要があります。
免責事項
この情報および投稿は、TradingViewが提供または推奨する金融、投資、トレード、その他のアドバイスや推奨を意図するものではなく、それらを構成するものでもありません。詳細は利用規約をご覧ください。