OPEN-SOURCE SCRIPT
Pivot Points (with Mid-Pivots)
Brief Description
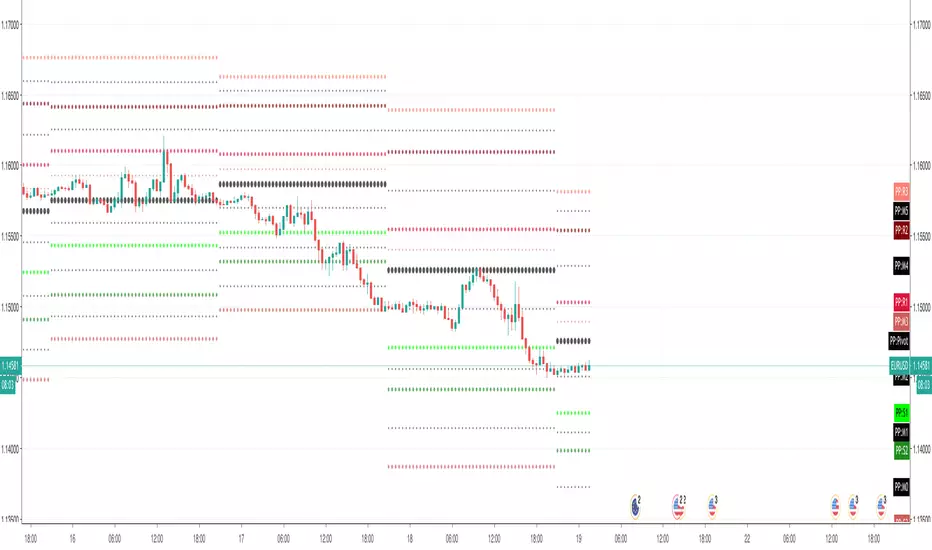
Pivot points are horizontal support and resistance lines placed on a price chart. They make strong levels of support and resistance because banks, financial institutions and many traders use them.
The indicator is set to the Daily Pivot Range by default (no support for weekly, monthly, quarterly, or yearly Pivots).
Indicator Settings
Show Mid-Pivots?
Show R3 and S3 levels?
オープンソーススクリプト
TradingViewの精神に則り、このスクリプトの作者はコードをオープンソースとして公開してくれました。トレーダーが内容を確認・検証できるようにという配慮です。作者に拍手を送りましょう!無料で利用できますが、コードの再公開はハウスルールに従う必要があります。
免責事項
この情報および投稿は、TradingViewが提供または推奨する金融、投資、トレード、その他のアドバイスや推奨を意図するものではなく、それらを構成するものでもありません。詳細は利用規約をご覧ください。
オープンソーススクリプト
TradingViewの精神に則り、このスクリプトの作者はコードをオープンソースとして公開してくれました。トレーダーが内容を確認・検証できるようにという配慮です。作者に拍手を送りましょう!無料で利用できますが、コードの再公開はハウスルールに従う必要があります。
免責事項
この情報および投稿は、TradingViewが提供または推奨する金融、投資、トレード、その他のアドバイスや推奨を意図するものではなく、それらを構成するものでもありません。詳細は利用規約をご覧ください。