OPEN-SOURCE SCRIPT
更新済 Bollinger + RSI Signals (by Bader Kamal)
This idea originally by ChartArt on January 14, 2015 as Strategy, and I modify it to become as Signals on 26 July 2019.
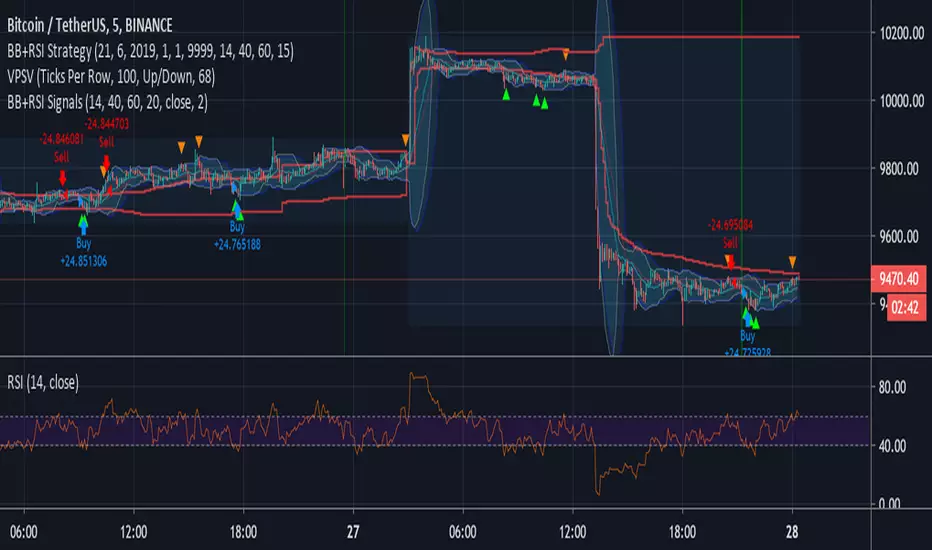
This signals uses a modified RSI to sell when the RSI increases over the value of 60 (or to buy when the value falls below 40), with the classic Bollinger Bands strategy to sell when the price is above the upper Bollinger Band (and to buy when this value is below the lower band).
This signals only triggers when both the RSI and the Bollinger Bands indicators are at the same time in a overbought or oversold condition.
リリースノート
I added Alert conditionsオープンソーススクリプト
TradingViewの精神に則り、このスクリプトの作者はコードをオープンソースとして公開してくれました。トレーダーが内容を確認・検証できるようにという配慮です。作者に拍手を送りましょう!無料で利用できますが、コードの再公開はハウスルールに従う必要があります。
免責事項
この情報および投稿は、TradingViewが提供または推奨する金融、投資、トレード、その他のアドバイスや推奨を意図するものではなく、それらを構成するものでもありません。詳細は利用規約をご覧ください。
オープンソーススクリプト
TradingViewの精神に則り、このスクリプトの作者はコードをオープンソースとして公開してくれました。トレーダーが内容を確認・検証できるようにという配慮です。作者に拍手を送りましょう!無料で利用できますが、コードの再公開はハウスルールに従う必要があります。
免責事項
この情報および投稿は、TradingViewが提供または推奨する金融、投資、トレード、その他のアドバイスや推奨を意図するものではなく、それらを構成するものでもありません。詳細は利用規約をご覧ください。