OPEN-SOURCE SCRIPT
更新済 Current Hourly Open Liquidity with Sweep Detection
Statistics indicate that if the current hourly candle reaches the high or low of the previous hourly candle, there is a strong likelihood that the price will return to the current hour's open, depending on how quickly the previous hour's high or low was swept. If the sweep occurs within the first 20 minutes, there is a 75% chance the current hour's open will be reached; if it takes between 21 and 40 minutes, the probability decreases to 50%; and if it takes longer than 41 minutes, the chance drops to 25%.
These statistics can help identify manipulation on the hourly timeframe and guide trade decisions accordingly. For instance, if the previous hourly high is taken within the first 20 minutes but the current hour's open is not reached, it may be wise to avoid long positions until it happens or consider short positions in the direction of the open liquidity, using your existing entry rules and risk management.
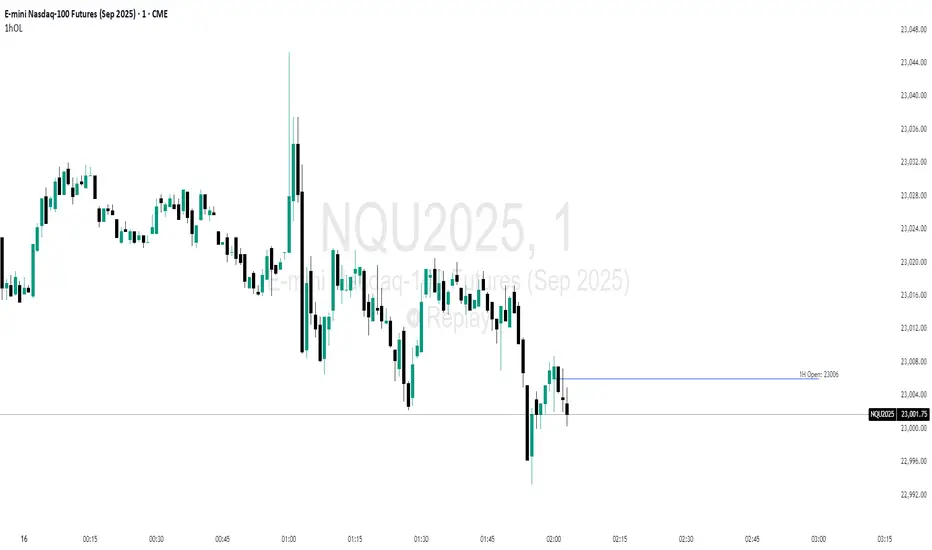
The indicator highlights the current hour's open with a line and label to visually represent that liquidity pool, adjusting the line's color based on whether and when the previous hour's high or low was tapped. Once the open is reached, the indicator can, depending on settings, remove the line and label from the chart (this is enabled by default) since the liquidity pool is no longer relevant, preventing chart clutter.
All colors, line widths, label text sizes, and colors can be customized.
These statistics can help identify manipulation on the hourly timeframe and guide trade decisions accordingly. For instance, if the previous hourly high is taken within the first 20 minutes but the current hour's open is not reached, it may be wise to avoid long positions until it happens or consider short positions in the direction of the open liquidity, using your existing entry rules and risk management.
The indicator highlights the current hour's open with a line and label to visually represent that liquidity pool, adjusting the line's color based on whether and when the previous hour's high or low was tapped. Once the open is reached, the indicator can, depending on settings, remove the line and label from the chart (this is enabled by default) since the liquidity pool is no longer relevant, preventing chart clutter.
All colors, line widths, label text sizes, and colors can be customized.
リリースノート
Added ability to disable label by setting label template to an empty stringYou can now also control label text, which allows inclusion of {{price}} - hourly open and {{time}} of the hourly candle (i.e. 12pm)
リリースノート
Added ability to control line style for hourly openリリースノート
Fixed time to be in short Am/Pm formatリリースノート
Fine-tunning label positionリリースノート
The original breakdown of hour into 3 oversimplified zones proved to be incorrect based on actual data analysis explained in full on Twitter(X). I ran my own data analysis, examined 15 years of hourly candlestick data and came up with specific hourly thresholds that are actually representative of price action.
The colors are now assigned according to those values and depend on each hour.
リリースノート
Added missing hoursオープンソーススクリプト
TradingViewの精神に則り、このスクリプトの作者はコードをオープンソースとして公開してくれました。トレーダーが内容を確認・検証できるようにという配慮です。作者に拍手を送りましょう!無料で利用できますが、コードの再公開はハウスルールに従う必要があります。
免責事項
この情報および投稿は、TradingViewが提供または推奨する金融、投資、トレード、その他のアドバイスや推奨を意図するものではなく、それらを構成するものでもありません。詳細は利用規約をご覧ください。
オープンソーススクリプト
TradingViewの精神に則り、このスクリプトの作者はコードをオープンソースとして公開してくれました。トレーダーが内容を確認・検証できるようにという配慮です。作者に拍手を送りましょう!無料で利用できますが、コードの再公開はハウスルールに従う必要があります。
免責事項
この情報および投稿は、TradingViewが提供または推奨する金融、投資、トレード、その他のアドバイスや推奨を意図するものではなく、それらを構成するものでもありません。詳細は利用規約をご覧ください。