OPEN-SOURCE SCRIPT
Co-Relation by Onur
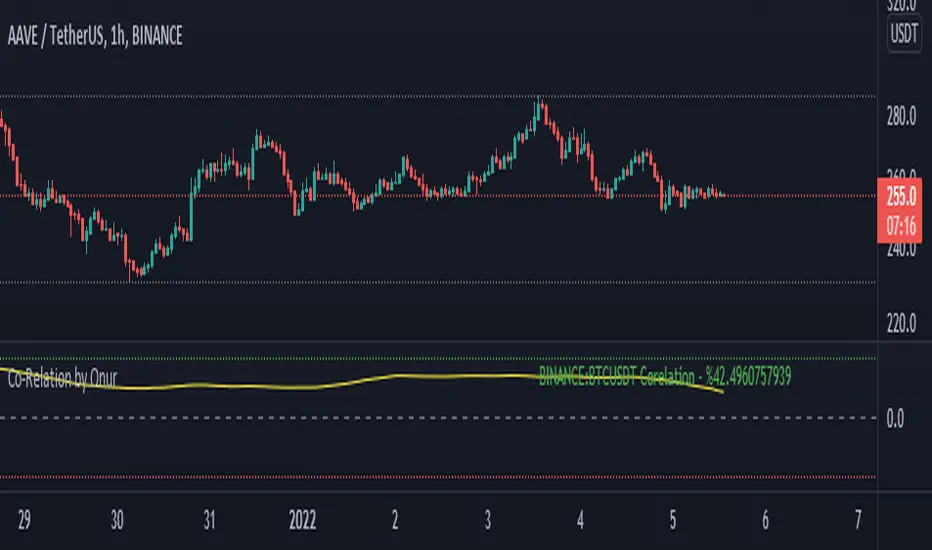
This indicator can statistically compare ANY asset in Tradingview with the asset in the active chart. It helps to understand positive or negative corelation btw 2 assets with percentage. Indicator value oscillates btw +100 and -100. If value is close to +100, there is a positive co-relation and if value is close to -100, there is a negative co-relation.
Indicator has 2 variables:
Symbol: The symbol (BTCUSDT by Default) that you'd like to compare with chart.
Period: Is the number of backward candles (200 by Default) for indicator co-relation calculation.
You can increase Period value to understand a long term relationship btw 2 assets.
Indicator has 2 variables:
Symbol: The symbol (BTCUSDT by Default) that you'd like to compare with chart.
Period: Is the number of backward candles (200 by Default) for indicator co-relation calculation.
You can increase Period value to understand a long term relationship btw 2 assets.
オープンソーススクリプト
TradingViewの精神に則り、このスクリプトの作者はコードをオープンソースとして公開してくれました。トレーダーが内容を確認・検証できるようにという配慮です。作者に拍手を送りましょう!無料で利用できますが、コードの再公開はハウスルールに従う必要があります。
免責事項
この情報および投稿は、TradingViewが提供または推奨する金融、投資、トレード、その他のアドバイスや推奨を意図するものではなく、それらを構成するものでもありません。詳細は利用規約をご覧ください。
オープンソーススクリプト
TradingViewの精神に則り、このスクリプトの作者はコードをオープンソースとして公開してくれました。トレーダーが内容を確認・検証できるようにという配慮です。作者に拍手を送りましょう!無料で利用できますが、コードの再公開はハウスルールに従う必要があります。
免責事項
この情報および投稿は、TradingViewが提供または推奨する金融、投資、トレード、その他のアドバイスや推奨を意図するものではなく、それらを構成するものでもありません。詳細は利用規約をご覧ください。