OPEN-SOURCE SCRIPT
更新済 The Rush
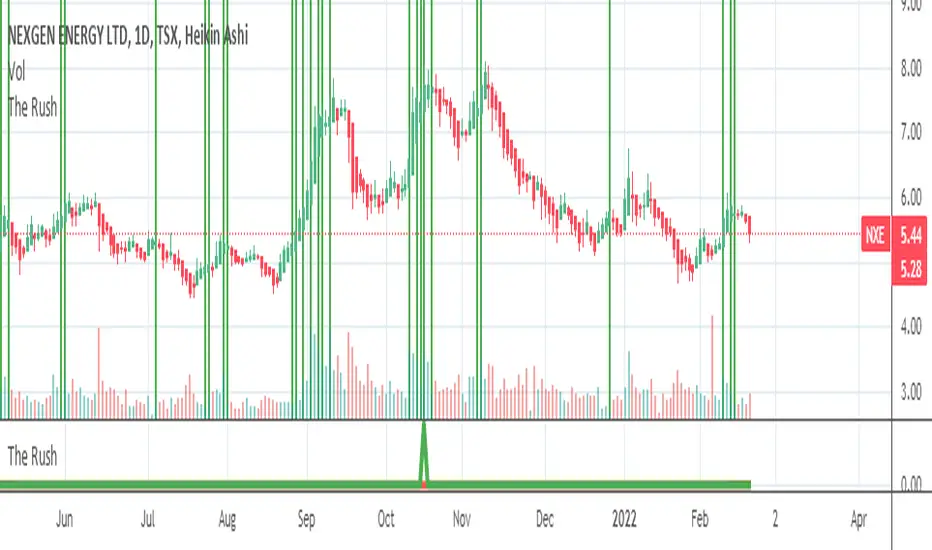
█ OVERVIEW
This script shows when buyers are in a rush to buy and when sellers are in a rush to sell
═════════════════════════════════════════════════════════════════════════
█ CONCEPTS
Prophet Mohamed Peace be upon Him once said something similar to this "It is not advisable to trade if you do not know the
Volume".
In his book "The Day Trader's Bible - Or My Secret In Day trading Of Stocks", Richard D. Kickoff wrote in page 55
"This shows that there was only 100 shares for sale at 180 1/8, none at all at 180f^, and only 500 at 3/8. The jump from 1 to 8 to 3/8
Emphasizes both the absence of pressure and persistency on the part of the buyers. They are not content to wait patiently until they can
Secure the stock at 180^/4; they "reach" for it."
This script was inspired by these two great men.
Prophet Mohamed Peace be upon Him showed the importance of the volume and Richard D. Kickoff explained what Prophet
Mohamed Peace be upon Him meant.
So I created this script that gauge the movement of the stock and the sentiments of the traders.
═════════════════════════════════════════════════════════════════════════
• FEATURES: The script calculates The Percentage Difference of the price and The Percentage Difference of the volume between
two success bullish candles (or two success bearish candles) and then it creates a ratio between these two Percentage
Differences and in the end the ratio is compared to the previous one to see if there is an increase or a decrease.
═════════════════════════════════════════════════════════════════════════
• HOW TO USE: if you see 2 or more successive red bars that mean bears are in hurry to sell and you can expect a bearish trend soon
if the Market Maker allows it or later if the Market Maker wants to do some distribution.
if you see 2 or more successive green bars that mean bulls are in hurry to buy and you can expect a bullish trend soon if the Market
Maker allows it or later if the Market Maker wants to do some accumulation.
═════════════════════════════════════════════════════════════════════════
• LIMITATIONS:
1- Use only Heikin Ashi chart
2- Good only if volume data is correct , meaning good for a centralized Market. (You can use it for forex or
crypto but at your own risk because those markets are not centralized)
═════════════════════════════════════════════════════════════════════════
• THANKS: I pay homage to Prophet Mohamed Peace be upon Him and Richard D. Kickoff who inspired the creation of this
Script.
═════════════════════════════════════════════════════════════════════════
リリースノート
Typo mistake Richard D. Kickoff is Richard D. Wyckoff a great traderリリースノート
Elimination of the small signals リリースノート
1- Regular Bar candle can be also be used • HOW TO USE: if you see red line of value equal -75 or less that mean bears are in hurry to sell and you can expect a bearish trend soon
if the Market Maker allows it or later if the Market Maker wants to do some distribution.
if you see green line of value equal 75 or more that mean bulls are in hurry to buy and you can expect a bullish trend soon if the Market
Maker allows it or later if the Market Maker wants to do some accumulation.
リリースノート
1- Regular Bar candle chart can be also be used with some time frames otherwise use Heikin Ashi chartリリースノート
the modification that was made to eliminate weak signals was not appreciated so here is the original versionオープンソーススクリプト
TradingViewの精神に則り、このスクリプトの作者はコードをオープンソースとして公開してくれました。トレーダーが内容を確認・検証できるようにという配慮です。作者に拍手を送りましょう!無料で利用できますが、コードの再公開はハウスルールに従う必要があります。
免責事項
この情報および投稿は、TradingViewが提供または推奨する金融、投資、トレード、その他のアドバイスや推奨を意図するものではなく、それらを構成するものでもありません。詳細は利用規約をご覧ください。
オープンソーススクリプト
TradingViewの精神に則り、このスクリプトの作者はコードをオープンソースとして公開してくれました。トレーダーが内容を確認・検証できるようにという配慮です。作者に拍手を送りましょう!無料で利用できますが、コードの再公開はハウスルールに従う必要があります。
免責事項
この情報および投稿は、TradingViewが提供または推奨する金融、投資、トレード、その他のアドバイスや推奨を意図するものではなく、それらを構成するものでもありません。詳細は利用規約をご覧ください。