OPEN-SOURCE SCRIPT
更新済 OBV's %B
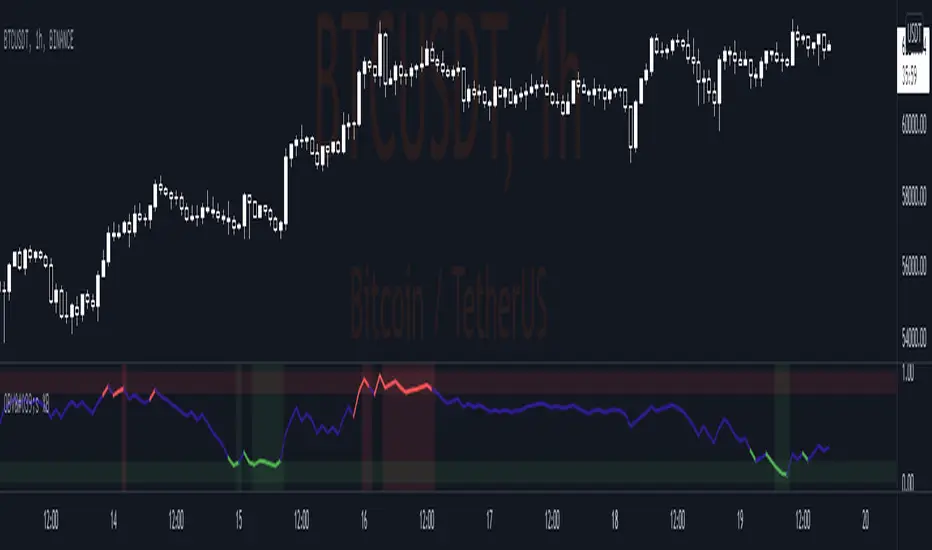
Indicator display where OBV (On Balance Volume) is in relation to the bands of Bollinger Bands (OBV,100,3)
A. OBV's Bb Info
1. Basis = SMA (OBV,100)
2. Upper Band = Basis + 3 x Standard Deviation
3. Lower Band = Basis - 3 x Standard Deviation
B. OBV's %B Info
1. %B Above 1 = OBV is Above the Upper Band
2. %B Below 0 = OBV is Below the Lower Band
3. %B Above 0.8 = OBV is Nearing the Upper Band
4. %B Below 0.20 = OBV is Nearing the Lower Band
リリースノート
* Update to Pine version 5* Add Signal Background
* Buy Signal:
- When obv inside Support Zone (0.0 - 0.2)
* Sell Signal:
- When obv inside Resistance Zone (0.8 - 1.0)
オープンソーススクリプト
TradingViewの精神に則り、このスクリプトの作者はコードをオープンソースとして公開してくれました。トレーダーが内容を確認・検証できるようにという配慮です。作者に拍手を送りましょう!無料で利用できますが、コードの再公開はハウスルールに従う必要があります。
免責事項
この情報および投稿は、TradingViewが提供または推奨する金融、投資、トレード、その他のアドバイスや推奨を意図するものではなく、それらを構成するものでもありません。詳細は利用規約をご覧ください。
オープンソーススクリプト
TradingViewの精神に則り、このスクリプトの作者はコードをオープンソースとして公開してくれました。トレーダーが内容を確認・検証できるようにという配慮です。作者に拍手を送りましょう!無料で利用できますが、コードの再公開はハウスルールに従う必要があります。
免責事項
この情報および投稿は、TradingViewが提供または推奨する金融、投資、トレード、その他のアドバイスや推奨を意図するものではなく、それらを構成するものでもありません。詳細は利用規約をご覧ください。